Fig 4.
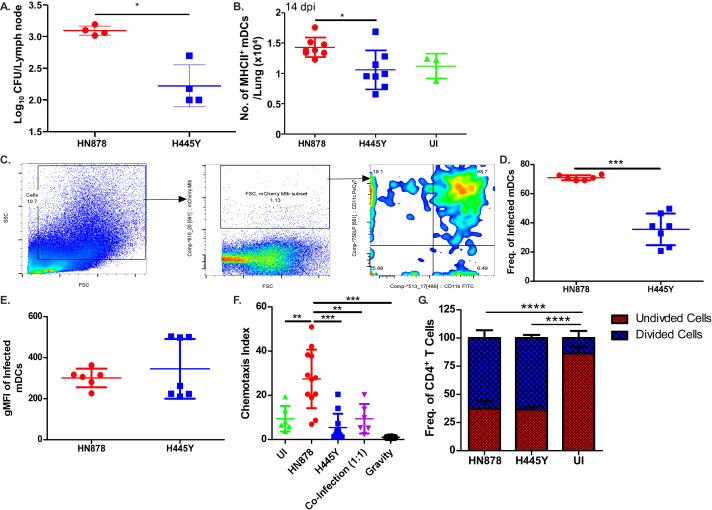
Impaired T cell responses are driven by defects in myeloid dendritic cell migration in rpoB-H445Y Mtb infection. B6 mice were aerosol infected with a low dose of either Wt or rpoB-H445Y Mtb and sacrificed at 14 dpi for analysis. (A) Bacterial burden in the lymph nodes was determined by plating. (B) Numbers of MHC Class II+ mDCs were determined by flow cytometry. Uninfected mice were also included (n = 3). B6 mice were aerosol infected with a low dose of either mCherry-expressing Wt or rpoB-H445Y Mtb. (C) Gating strategy for Mtb-infected cells in the lung is shown. (D) The frequencies of Mtb-infected lung cells that are mDCs (CD11c+ CD11b+) and (E) the geometric mean fluorescent intensity (MFI) of mCherry expression in infected mDCs were calculated. BMDCs were infected with either Wt or rpoB-H445Y Mtb or co-infected at a ratio of 1:1 Wt:rpoB-H445Y at a multiplicity of infection (MOI) of 1. (F) One day post infection, in vitro chemotaxis assays were carried out toward CCL-19, and a chemotaxis index was calculated. (G) One day post infection, BMDCs were co-cultured with isolated, enriched, and carboxyfluorescein succinimidyl ester (CFSE)-labeled CD4+ T cells from naïve ESAT-6 ab TCR mice at a ratio of 1:1. The data shown are the frequencies of divided and undivided cells, as represented by the expression of CFSE determined using flow cytometry. The data shown represent the means ± SD of four to seven biological replicates per experiment (A–E), technical replicates combined over two experiments (F), or technical replicates from a representative experiment (G). Significant differences are indicated with asterisks (*P < 0.05; **P < 0.01; ***P < 0.001) by Kruskal-Wallis test with Dunn’s multiple comparisons tests (A–G).

