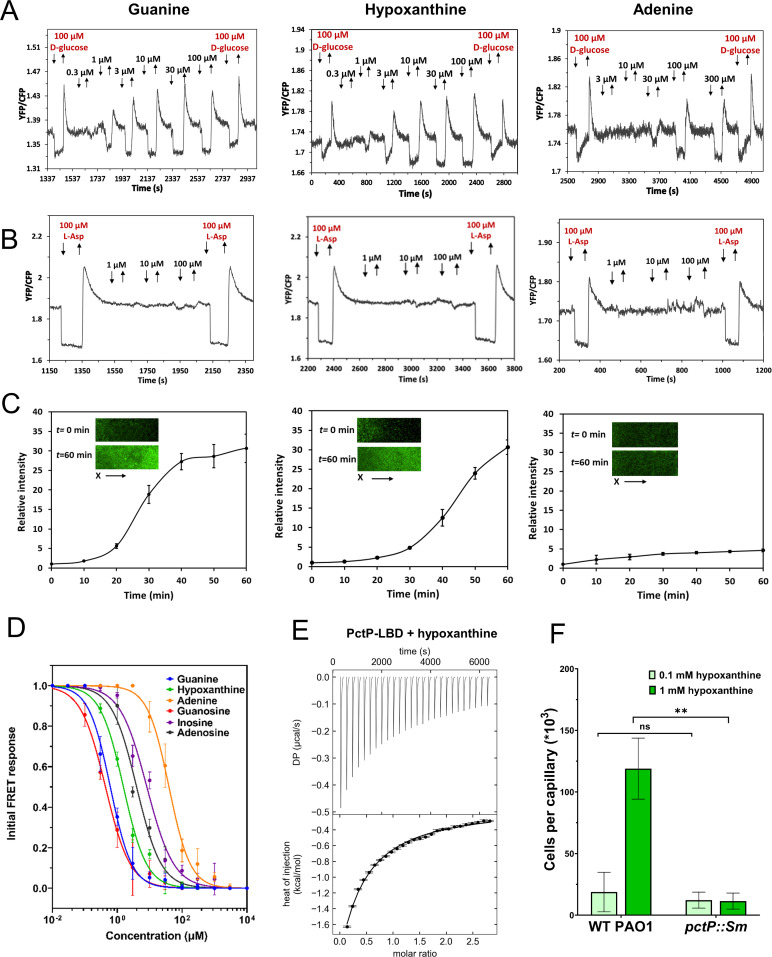
Fig 4.
Characterization of PA1608 (PctP) as a purine-specific chemoreceptor. (A, B) FRET measurements for E. coli cells expressing PctP-Tar hybrid (A) or Tar receptor (B) as a sole receptor to the indicated concentrations of guanine, hypoxanthine, or adenine. FRET measurements were performed as described in Fig. 2. (C) Microfluidic assay of the chemotactic response of E. coli expressing PctP-Tar as the sole receptor and GFP as a label. Relative cell density (fluorescence intensity of GFP) in the observation channel over time in gradients of guanine, hypoxanthine, or adenine (in the same order as in A and B), with 50 mM in the source channel as indicated. Cell density in the observation channel before ligand stimulation (t = 0) was used to normalize all data. Error bars indicate standard deviation of three independent biological replicates. Insets show representative images of the observation channel at the beginning and the end of an experiment. The x-components (black arrow) indicate the direction up the concentration gradient. (D) Dose-response curves for FRET measurements of responses mediated by PctP-Tar. The amplitudes of the initial FRET response were calculated from changes in the ratio of YFP/CFP fluorescence after stimulation with indicated ligand concentrations and normalized to the saturated response. Error bars indicate the standard errors of three independent experiments; wherever invisible, error bars are smaller than the symbol size. Data were fitted using the Hill equation, and the EC50 fit values are shown in Table 2. (E) Microcalorimetric titrations of PctP-LBD with hypoxanthine. The upper panel shows the raw titration data, and the lower panel shows the integrated dilution-heat corrected and concentration-normalized peak areas fitted with the model for binding with negative cooperativity to two symmetric sites. Further experimental details are shown in Table S4. (F) Capillary chemotaxis assays of P. aeruginosa PAO1 and a pctP mutant to 0.1 mM and 1 mM hypoxanthine. The pctP mutant was derived from the Washington parental strain that was used as a WT PAO1 in this measurement. Data are shown as the means and standard deviations three biological replicates each conducted in triplicate. Significance of difference, assessed using a paired t-test, is indicated by asterisks (ns: nonsignificant, **P ≤ 0.01).

