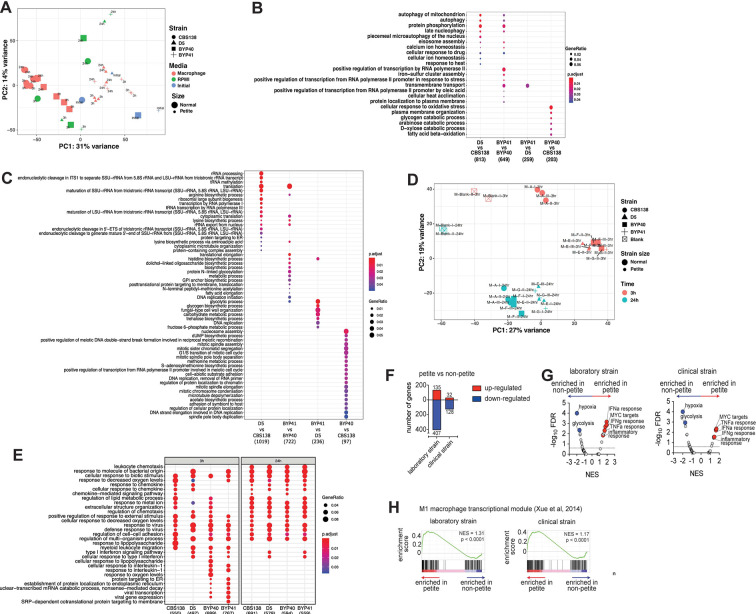
Fig 3.
Principal component analysis (PCA) plot of all studied C. glabrata samples across studied conditions. The plot is based on vst-transformed read count data generated by DESeq2. Labels on the data points correspond to timepoints of the experiments. Percentages on PC1 and PC2 axes indicate the total amount of variance described by each axis (A). GO term enrichment analysis (category “Biological Process”) of up-regulated genes of C. glabrata at a given comparison shown on the X axis. The numbers underneath the comparisons correspond to the “counts” of clusterProfiler (i.e., total number of genes assigned to GO categories). GeneRatio corresponds to the ratio between the number of input genes assigned to a given GO category and “counts.” Only significant (P adj < 0.05) enrichments are shown. Adjustment of P-values is done by Benjamini-Hochberg procedure (B). Petitness-specific GO terms such as tRNA and rRNA related processes, biosynthesis of several amino acids as arginine and lysine, among others. When compared to laboratory-derived petites, clinical petites showed down-regulation of carbohydrate biosynthesis and fungal cell-wall-related processes. Finally, the comparisons of non-clinical strains of normal size showed down-regulation of various processes in the clinical stains, such as nucleosome and mitotic spindle assembly, methionine, and acetate metabolism (C). Principal component analysis plot of all studied macrophage samples. The plot is based on vst-transformed read count data generated by DESeq2. Labels on the data points correspond to internal sample identifiers. Percentages on PC1 and PC2 axes indicate the total amount of variance described by each axis (D). GO term enrichment analysis (category “Biological Process”) of up-regulated genes of macrophages infected with C. glabrata strains (as depicted on X axis) compared to unchallenged macrophages (E). The numbers underneath the comparisons correspond to the “counts” of clusterProfiler (i.e., total number of genes assigned to GO categories). GeneRatio corresponds to the ratio between the number of input genes assigned to a given GO category and “counts.” Only significant (P adj < 0.05) enrichments are shown. Adjustment of P-values is done by Benjamini-Hochberg procedure. C. glabrata petite strains induce a pro-inflammatory transcriptional program in human THP-1 macrophage cells. Summary data of differentially expressed transcripts in THP-1 macrophages at 24 h post-challenge; comparisons are between THP-1 transcriptomes challenged with petite vs non-petite C. glabrata laboratory or clinical strains (F). Gene set enrichment analysis (GSEA) indicating significantly enriched “Hallmark” pathways of the Molecular Signatures Database, based on the RNA-seq data from THP-1 cells at 24 h post-fungal challenge. The pathways are displayed based on the normalized enrichment score (NES) and the false discovery rate (FDR). The dotted line marks an FDR value of 0.25, while a select top enriched pathways are indicated Blue (enriched in non-petite) and Red (enriched in Petite) (G). GSEA enrichment plots depicting enrichment of the M1 macrophage transcriptional module (29) comparing transcriptomes THP-1 cells challenged with the petite vs non-petite C. glabrata laboratory or clinical strains at 24 h post-challenge (H). The P value reported here is the nominal P-value, while NES is the normalized enrichment score.

