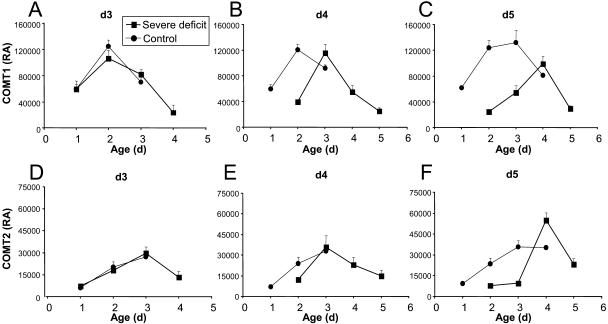
Figure 3.
Relative amounts of COMT isoforms in function of tissue age in Io leaves of experiment 2. Relative amounts of COMT1 in leaves harvested at day 3 (A), day 4 (B), and day 5 (C) are shown. Relative amounts of COMT2 in leaves harvested at day 3 (D), day 4 (E), and day 5 (F) also are shown. Vertical bars show se (n = 4 to 11). RA, Relative amount.

