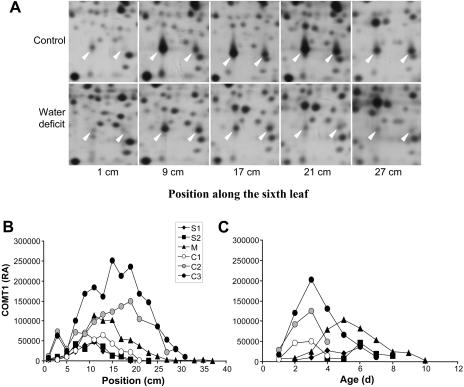
Figure 5.
Variation of relative amounts of COMT with leaf development. A, Silver-stained 2D gel of leaf proteins from the F2 inbred line in experiment 3. Arrowheads indicate COMT1 (left) and COMT2 (right). B, Relative amount of COMT1 along the leaves of F2 plants in experiment 3. C, Relative amount of COMT1 in function of tissue age of F2 leaves in experiment 3.

