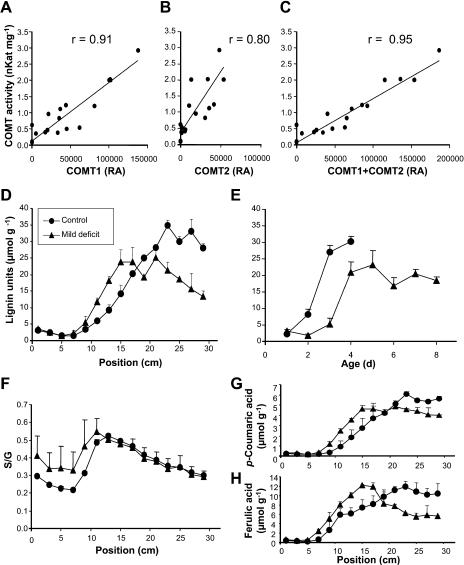
Figure 6.
Relation between COMT and lignification profiles. A to C, In vitro activity of COMT in function of relative amounts of COMT1 and COMT2 measured on 2D gels. r, Correlation coefficient. D, Measurement of uncondensed lignin units (H + G + 5OHG + S) along leaf 6 in experiment 3. E, Measurement of uncondensed lignin units in function of tissue age. F, S:G ratio along leaf 6. G, Measurement of FA along leaf 6 in experiment 3. Vertical bars show se (n = 2 in D, F, and G; n = 3–8 in E). RA, Relative amount.

