
Figure 5.
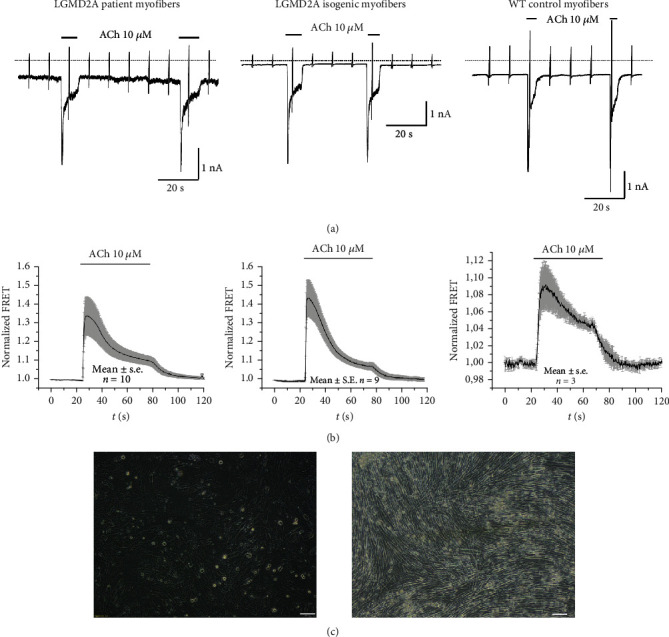
(a) Representative recordings (n = 8 cells) of ACh-induced currents in LGMD2A patient, their isogenic control, and WT (cord blood) iPSC-derived skeletal muscle cells. ACh (10 μM) was applied as indicated by the bar. Holding potential -90 mV. Downward deflections represent membrane currents in response to depolarizing voltage ramps (duration 500 ms) from -120 mV to +60 mV. Dashed line indicates zero current level. (b) Summarized FRET recordings in LGMD2A iPSC, their isogenic control, and WT (cord blood) iPSC-derived skeletal muscle cells; transfected with Twitch2B to monitor the increase in [Ca2+]i during ACh application. (c) Morphology of LGMD2A iPSC derived skeletal muscle cells on day 12 and day 40 after differentiation induction (2D protocol) scale bars 100 μM.