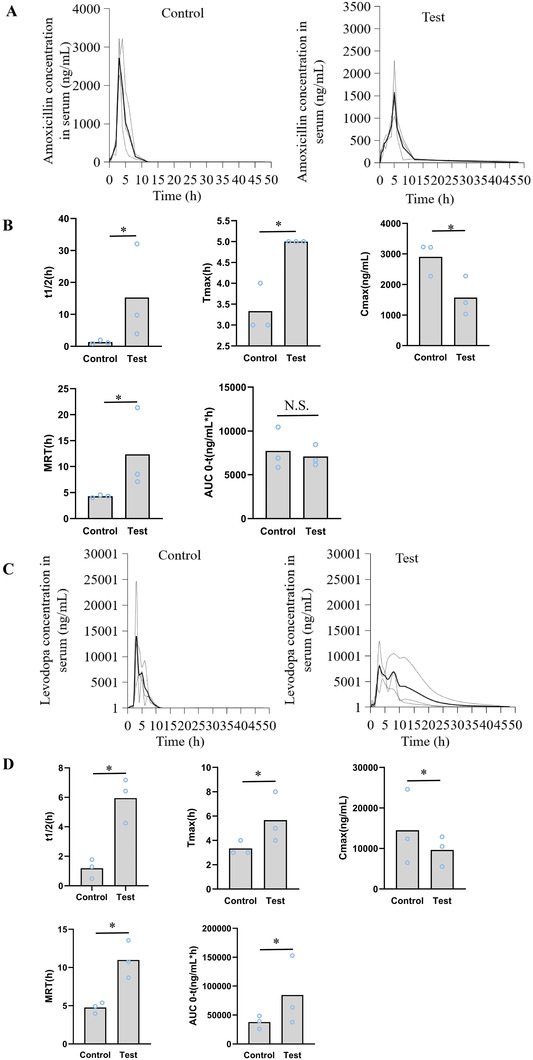
Figure 6.

Drug delivery pharmacokinetic evaluation in vivo. A) The serum concentration‐time curve of amoxicillin when administered as control pills and ALG‐DA pills in pigs. Data is represented as mean ± S.D., n = 3. B) The pharmacokinetic parameters of amoxicillin when administered as control pills and ALG‐DA pills in pigs. Data is represented as mean ± S.D., n = 3. C) The serum concentration‐time curve of levodopa when administered as control pills and ALG‐DA pills in pigs. Data is represented as mean ± S.D., n = 3. D) The pharmacokinetic parameters of levodopa when administered as control pills and ALG‐DA pills in pigs. Data is represented as mean ± S.D., n = 3. *indicates p < 0.05, which demonstrates that differences are statistically significant. N.S. indicates that differences are not statistically significant, independent sample T‐test.
