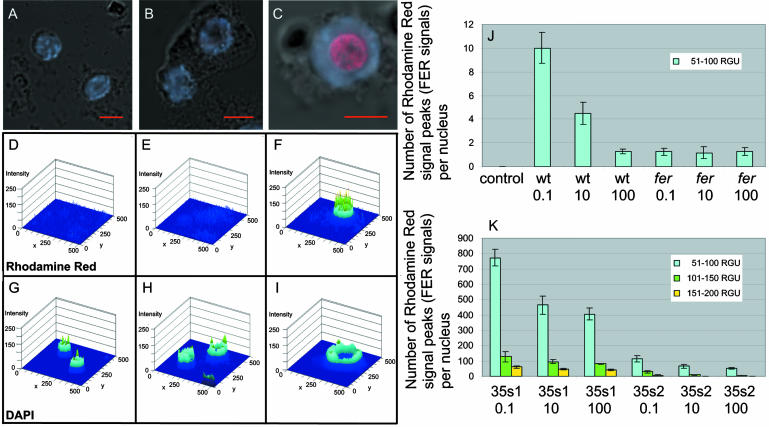
Figure 3.
Immunolocalization of FER on single root tip nuclei detected by anti-N-FER antiserum, followed by rhodamine red-coupled anti-rabbit IgG and counterstained with DAPI. A to C, Superimposed confocal images of rhodamine red, DAPI, and differential interference contrast (DIC). D to I, Diagrams, created by the laser scanning microscope 5 image software, presenting the respective rhodamine red (D–F) and DAPI (G–I) fluorescent signal peaks. The images represent the intensities of the fluorescent signals plotted on the same surface as the respective superimposed confocal image in A to C. Different levels of fluorescent signal intensities are represented by different colors: blue, 1 to 50 RGU; blue-green, 51 to 100 RGU; green, 101 to 150 RGU; and yellow, 151 to 200 RGU. The images represent examples for the fer mutant (A, D, and G), wild-type grown at 0.1 FeNaEDTA (B, E, and H), and 35s1 plants grown at 0.1 μm FeNaEDTA (C, F, and I). J, Mean number of fluorescent rhodamine red signal peaks per nucleus for the negative control (secondary antibody omitted), fer mutant, and wild-type plants under all iron supply conditions tested (μm FeNaEDTA). Only signal peaks with intensities between 51 to 100 RGU were counted. Higher signal intensities were not detected for these samples. sd are indicated; n = 10 nuclei. K, Mean number of fluorescent rhodamine red signal peaks per nucleus for 35s1 and 35s2 plants grown under different iron supply conditions (μm FeNaEDTA). Three levels of fluorescent signal intensities were counted, between 51 and 200 RGU. sd are indicated; n = 10 nuclei.

