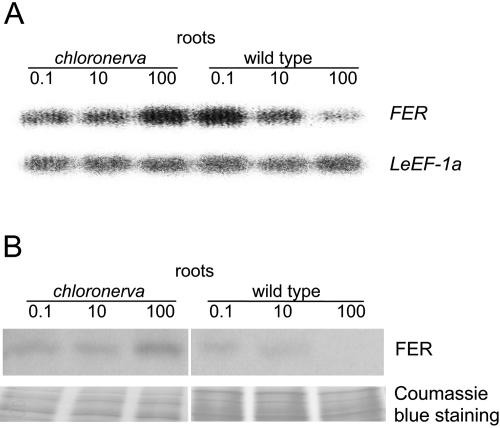
Figure 6.
LeFER expression in chloronerva plants. A, Semiquantitative RT-PCR analysis of FER mRNA levels in roots from chloronerva and wild-type plants grown under deficient (0.1 μm), sufficient (10 μm), and generous (100 μm) iron supply. FER transcript abundance is normalized according to the constitutively expressed LeEF-1a gene. B, Western-blot analysis using anti-N-FER antiserum on total root extracts from chloronerva and wild-type plants grown under 0.1, 10, or 100 μm FeNaEDTA; 9 μg protein were loaded in each lane. Coomassie Blue staining was used to demonstrate equal loading with proteins.

