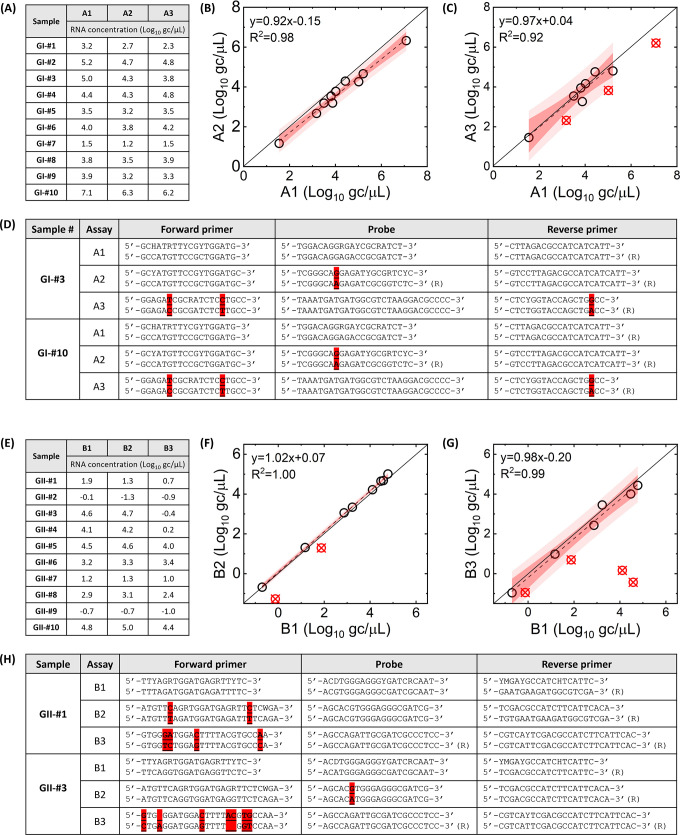
Fig 2.
Clinical samples analyzed by RT-qPCR assays. (A) and (E) show GI and GII RNA concentrations, respectively. GI RNA concentrations by A1 assay are compared to those by A2 (B) and A3 assay (C). GII RNA concentrations by B1 assay are compared to those by B2 (F) and B3 assay (G). Red circles with a cross indicate outliers that deviated from the regression line (a cutoff studentized residual is −1.5). Dark and pale shades represent 95% confidence and prediction intervals, respectively. Possible annealing sequences for GI-#3 and GI-#10 with A1, A2, and A3 assays are presented in (D). Possible annealing sequences for GI-#1 and GI-#3 with B1, B2, and B3 assays are presented in (H). Sequences of RT-qPCR assay and viral genome are illustrated top and bottom, respectively. Highlighted nucleotides show mismatches.

