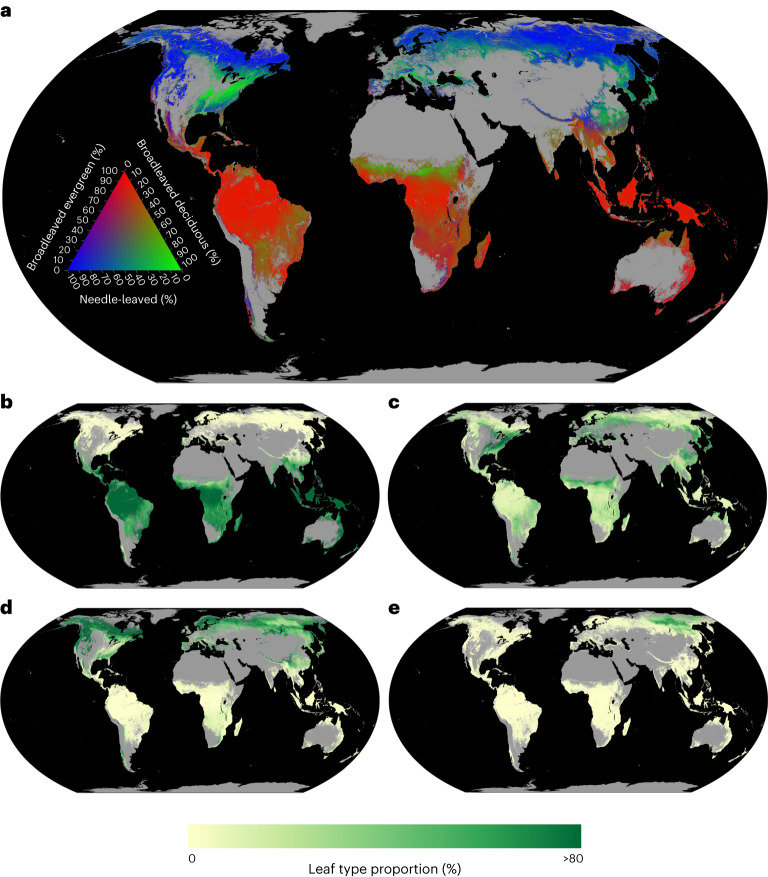
Fig. 2. The global distribution of forest leaf types.
a, The global distribution of tree leaf type as predicted by a random forest model built from area-based leaf-type data (see Methods). Pixels are coloured in the red, green and blue spectrum according to the percentage of total tree basal area occupied by broadleaved evergreen, broadleaved deciduous and needle-leaved tree types, as indicated by the ternary plot. Needle-leaved evergreen and needle-leaved deciduous forests were combined due to the low global coverage of needle-leaved deciduous trees. b–e, Predicted relative coverage of each leaf type from random forest models. Ref. 81 was used to mask non-forest areas. b, Broadleaved evergreen coverage. c, Broadleaved deciduous coverage. d, Needle-leaved evergreen coverage. e, Needle-leaved deciduous coverage.

