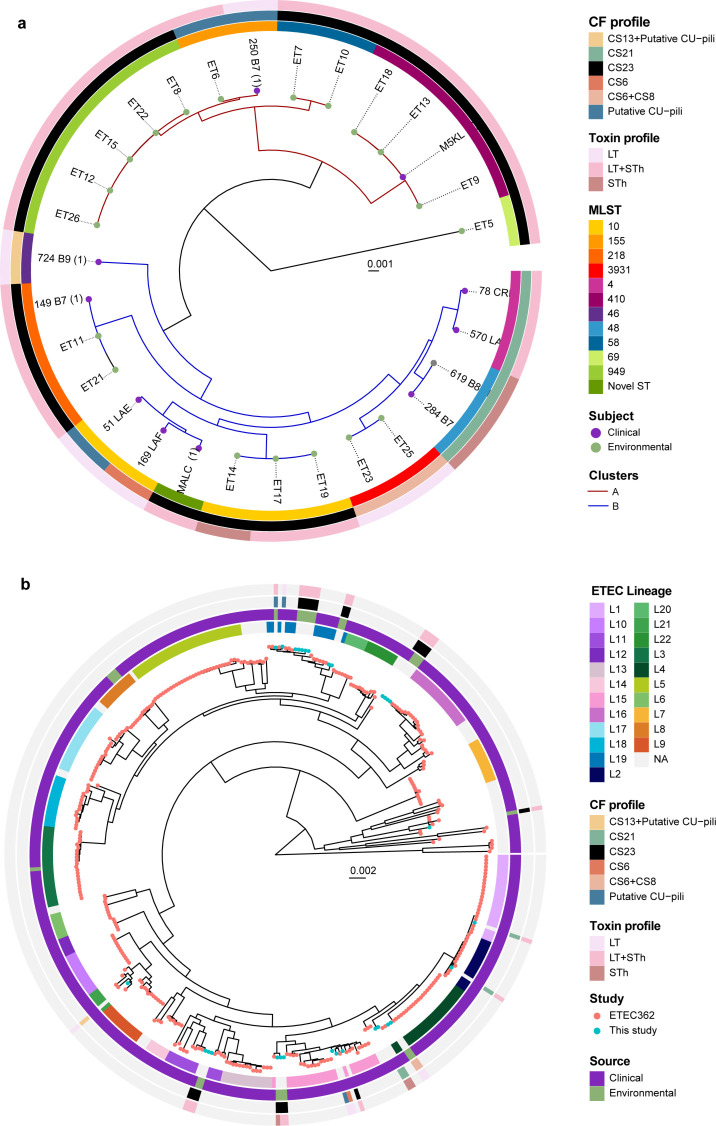
Fig 1.
Whole-genome phylogenetic analysis of ETEC. Maximum likelihood midpoint-rooted phylogenetic trees based on single-nucleotide polymorphism (SNP) differences in (a) 30 ETEC genomes collected in Bolivia and (b) in context with 362 selected ETEC genomes with representative virulence profiles isolated from indigenous patients and travelers between 1980 and 2011 from endemic countries (Asia, Africa, and North, Central and South America). The tip of the branches is color-coded according to the sample’s origin (clinical/environmental in this study and the 362 reference ETEC genomes). The colored rings represent the respective MLST and CF profiles, and the lineages L1–L21 are indicated. The scale bar represents the substitutions per variable site.

