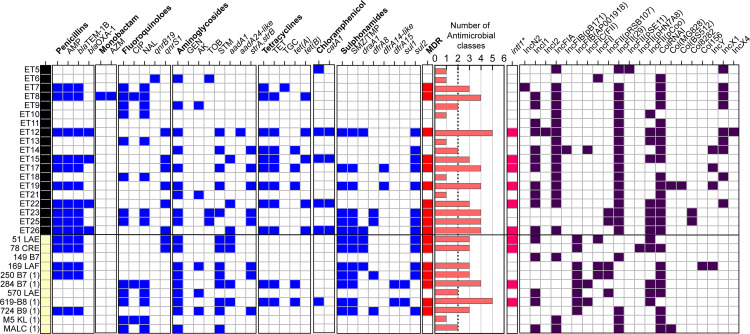
Fig 2.
Phenotypic and genomic characterization of antibiotic resistance among ETEC isolates. Environmental (black) and clinical (yellow) samples were subjected to a phenotypic disk diffusion test (capital letters). Antimicrobial resistance genes were extracted from ETEC genomes (in italics). The blue boxes represent resistant/positive isolates, and the red boxes indicate multidrug resistance (≥3 classes of antibiotics). The histogram illustrates the number of antimicrobial classes (written in bold) in which the ETEC strains were phenotypically resistant. Genomic identification (≥90% nucleotide identity and ≥90% nucleotide identity) of the mobile element class 1 integron (intI1) (GenBank: AEH26333.1). Characterization of different Incompatibility Group (Inc) plasmids detected in bacterial genomes. AMP, ampicillin; AZM, azithromycin; CIP, ciprofloxacin; NAL, nalidixic acid; GEN, gentamycin, AK amikacin; TOB, tobramycin; STM, streptomycin; TET, tetracycline; TGC, tigecycline; and TMP/SMZ, trimethoprim-sulfamethoxazole.

