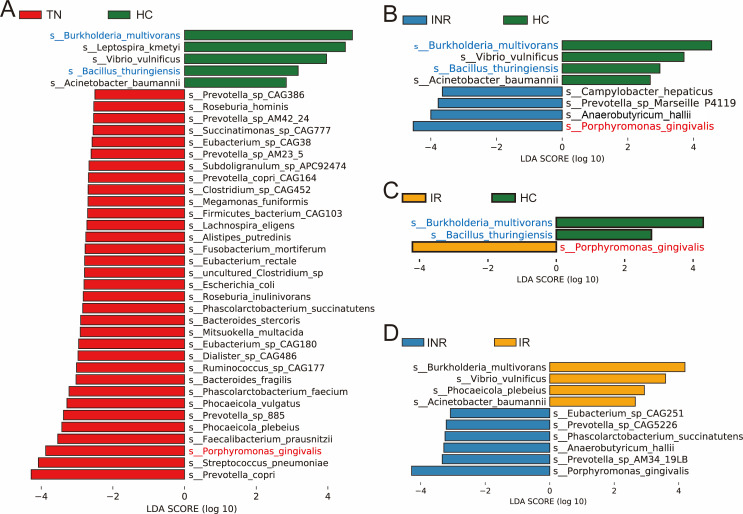
Fig 3.
Differential enrichment of microbes in every two groups. Linear discriminant analysis effect size analysis of discriminant taxa in the blood microbiota of pairwise combinations of TNs compared to HCs (A), INRs compared to HCs (B), IRs compared with HCs (C), and INRs compared to IRs (D). Compared to HCs, bacterial species with enriched abundance in individuals infected with HIV are marked in red, and enriched species in HCs are marked in blue. P < 0.05; LDA score >2.5.

