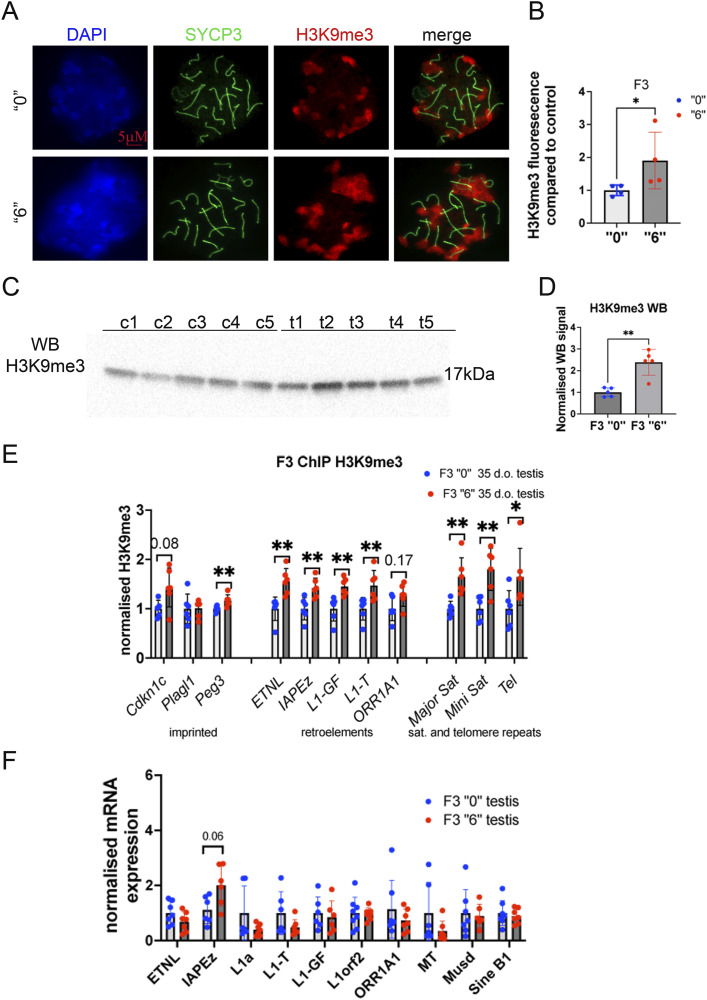
Figure 3. The effects of ancestral thiacloprid exposure on H3K9me3 levels and retroelement transcription activity.
(A) Representative image of 35-d-old F3 male testis spreads immunostained against H3K9me3 (red) or SYCP3 (green), bar is 5 µΜ. (B) Quantitative analysis of H3K9me3 intensity in F3 generation males, n = 5 dose “0,” n = 4 dose “6,” *P < 0.05 nonparametric Mann–Whitney test. (C) Representative image of H3K9me3 Western blot of testis tissue, c1-c5 are control, t1-t5 are thia -derived samples. (D) Quantitative analysis of Western blot, n = 5 dose “0,” n = 5 dose “6,” **P < 0.01 nonparametric Mann–Whitney test. (E) Quantitative ChIP‒qPCR analysis of H3K9me3 in 35-d-old testis of F3 males, n = 5 dose “0,” n = 5 dose “6,” *P < 0.05, **P < 0.01 nonparametric Mann–Whitney test. (F) The analysis of retroelement expression in 35-d-old testis of F3 males by RT–qPCR, n = 7 dose “0,” n = 7 dose “6.” All plots on the figure represent an averaged values ± SD.

