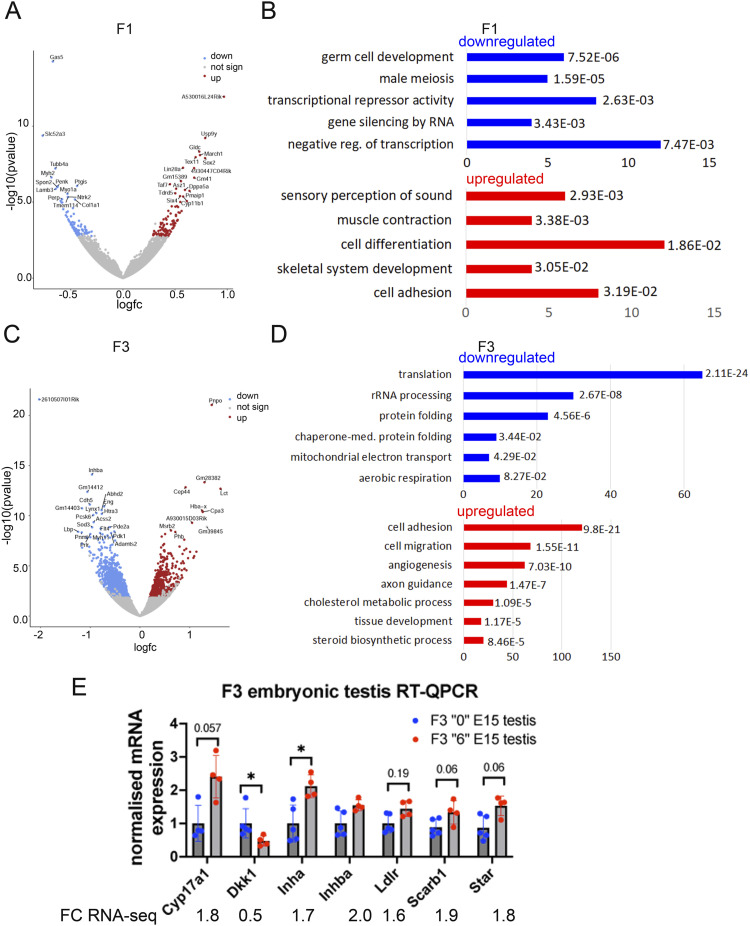
Figure 4. RNA-seq analysis in embryonic E15.5 F1 and F3 testes.
(A) Volcano plot of differentially expressed genes in F1 testis, down-regulated genes are in blue and up-regulated are in red, n = 3 dose “0,” n = 3 dose “6.” (B) Functional annotation of the down-regulated (blue) or up-regulated (red) differentially expressed genes in F1 embryonic testis were done using DAVID, Fisher’s exact test was adopted in DAVID to measure the gene-enrichment in annotation terms, the genes were sorted by P-value in F1. (C) Volcano plot of differentially expressed genes in F3, n = 3 for dose “0” and dose “6.” (D) The down-regulated (blue) and up-regulated genes (red) were annotated separately by using DAVID. The genes were sorted by adjusted P-value in F3. The bars represent the number of genes in each Gene Ontology group. (E) Quantitative RT‒qPCR analysis of DEGs in embryonic F3 testis, the RNA-seq fold change (FC) values are indicated under the graph. RT–qPCR plots represents an averaged values ± SD, n = 5 dose “0,” n = 4 dose “6.” *P < 0.05, nonparametric Mann–Whitney test.

