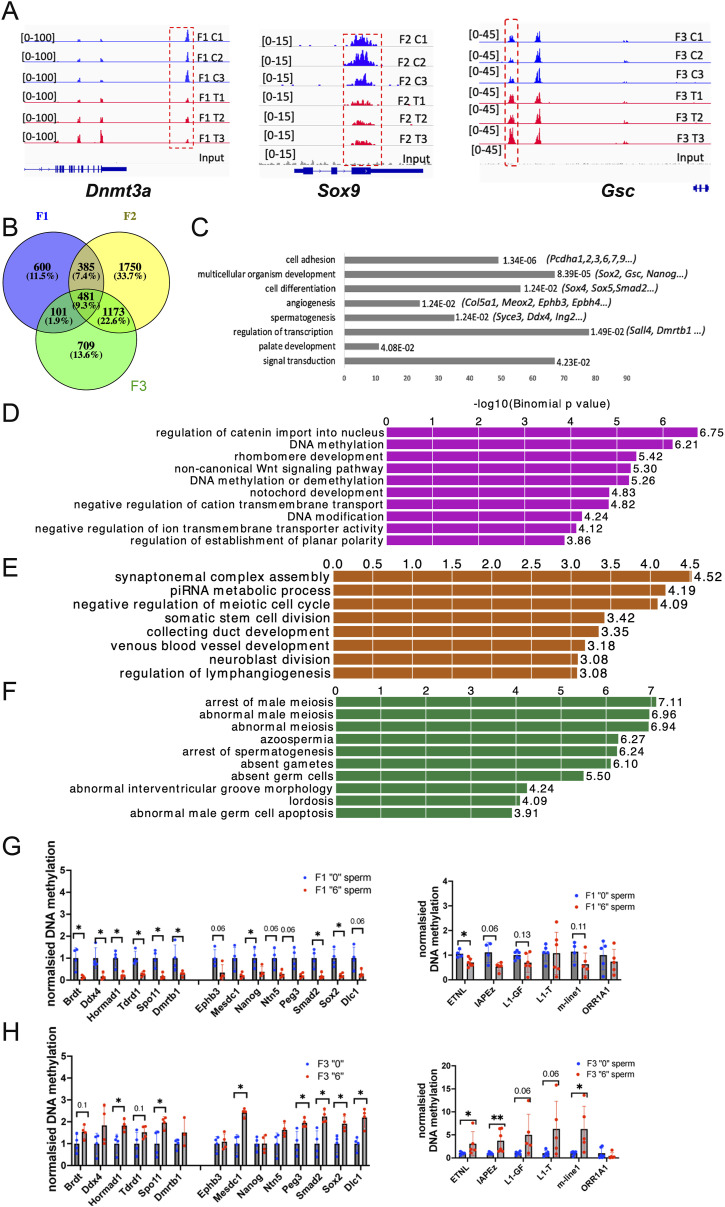
Figure 5. Genome-wide DNA methylation analysis in spermatozoa of the 2-mo-old F1, F2, and F3 mice.
(A) A representative image of mapped reads. The differentially methylated peaks near Dnmt3a, Sox9, and Gsc are shown in red dashed boxes. Plots from control samples are shown in blue, plots from thia-derived samples are shown in red. Each control and treatment groups contained minimum three replicates. The sequencing reads were mapped to the reference mm10 genome, normalized, and converted to bedgraph files which were visualized in IGV, the signal intensity is shown in brackets, and the differential peaks are marked by dashed box. (B) Venn plot represents common genes located in DMRs in F1, F2, and F3. (C) Functional annotation of genes located in common DMRs, bars sorted by adjusted P-values, and each bar represents the number of genes in each group. (D, E, F) Functional annotation “biological process” of genes located in DMRs (D) in F1, (E) in (F2) and (F) in F3 was performed by GREAT. Each bar represents –log 10 (binominal P-value) calculated by GREAT. (G, H) MEDIP-qPCR analysis in F1 and (H) in F3 E15 embryonic testis. Right plots are MEDIP–qPCR analysis of spermatogenesis and SE genes from spermatozoa of 2-mo-old males. F1, n = 4 dose “0,” n = 4 dose “6,” F3, n = 4 dose “0,” n = 4 dose “6.” The right plots represent the analysis of MEDIP-qPCR analysis of retroelements, F1: n = 6, dose “0,” n = 6 dose “6”; F3: n = 4 dose “0” and n = 4 dose “6.” MEDIP-qPCR plots are averaged MEDIP values ± SD, *P < 0.05, **P < 0.01 nonparametric Mann–Whitney test.

