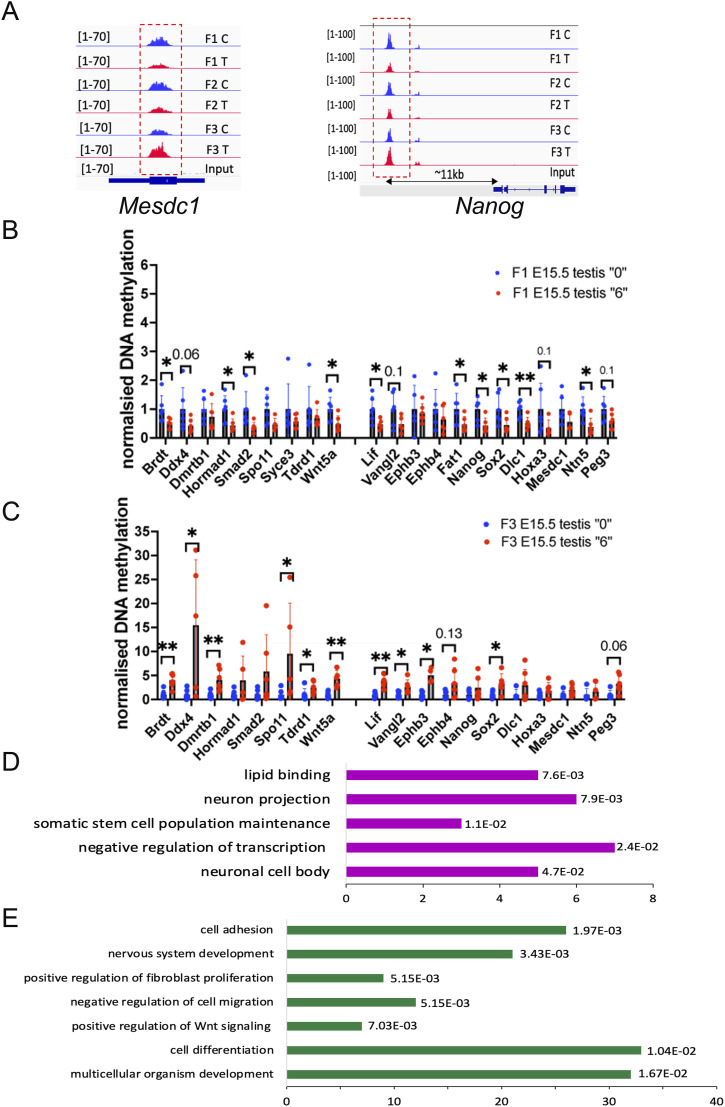
Figure 6. DNA methylation of SE and GRR regions changed in spermatozoa.
(A) At the vicinity of regions including superenhancers active in ES cells (Mescd1, Nanog). Each plot represents the normalized sequencing reads, the signal was calculated for each sample, and the statistically significant difference was calculated by the Limma test. Overlaid biological replicate plots from the control group are shown in blue, and overlaid biological replicate plots from the treatment group are shown in red. Signal intensity is shown in the brackets. (B, C) MEDIP–qPCR analysis in embryonic E15.5 testis (B) in F1 and (C) in F3, F1 and F3 n = 6 dose “0,” n = 6 dose “6.” MEDIP–qPCR plots represent averaged values of qPCR ± SD, *P < 0.05, **P < 0.01, nonparametric Mann–Whitney test. (D, E) Differentially expressed genes in RNA-seq have DMRs in MEDIP-seq data (D) in F1 and (E) in F3. The genes were sorted by P-value (in F1) or by adjusted P-value (in F3).

