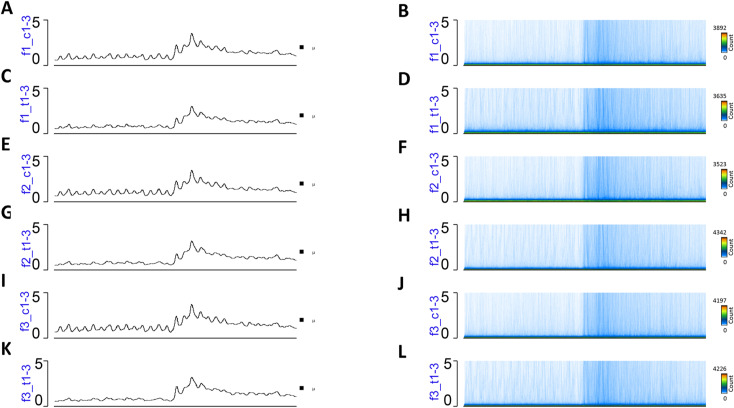
Figure S7. MEDIP-seq analysis in spermatozoa of F1, F2, and F3.
(A, B, C, D, E, F, G, H, I, J, K, L) A coverage map in (A, B) in control, (C, D) and 6 mg/kg/day thia F1, (E, F) in control F2 and (G, H) in 6 mg/kg/day thia F2, (I, J) in control F3 and (K, L) in F3 6 mg/kg/day thia. The X-axis represents the 50,000 bp surrounding each region, which was segmented into 400 bins and smoothed for 1 bin. Plots were generated by EaSeq.

