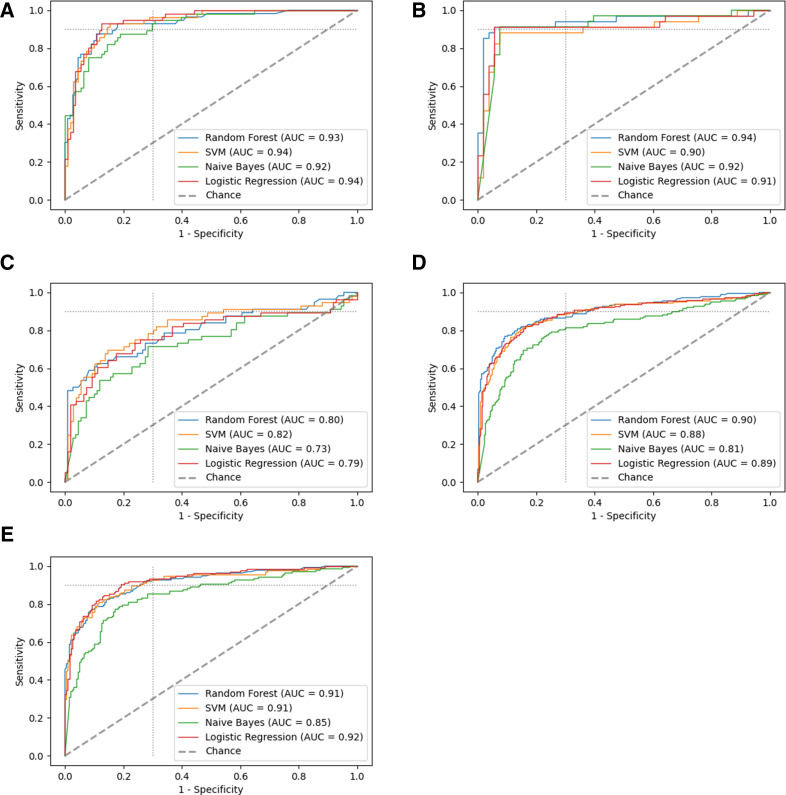
Fig 3.
The ROC plot of all 12 biomarkers combined for (A) South Africa alone, (B) Peru alone, (C) Vietnam alone, (D) the whole data set, and (E) the whole data set excluding Vietnam. The dotted light gray line indicates the TPP with 90% sensitivity and 70% specificity. AUC, area under the curve; SVM, support vector machine.

