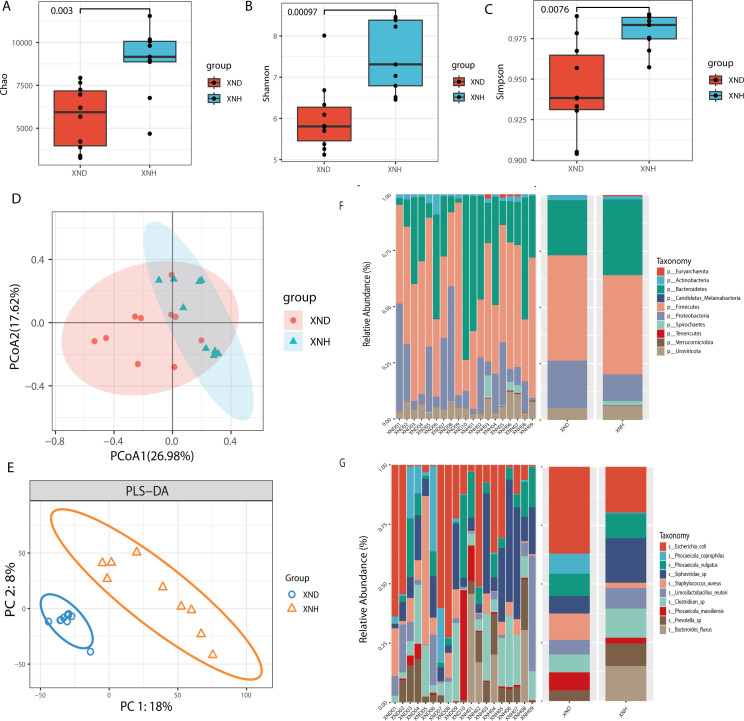
Fig 1.
Diversity and composition of gut microbiota between diarrheic and healthy calves. Alpha diversity including Chao1 (A), Shannon (B), and Simpsons (C) was displayed between two groups. Beta diversity including the PCoA (D) and PLS-DA (E) was analyzed between two groups. PCoA of bacterial community structure based on Buray-Curtis distances. PLS-DA of bacterial community structure based on gene abundance. Histogram showing top 10 relative abundance of phylum (F) and species (G) among samples or groups.

