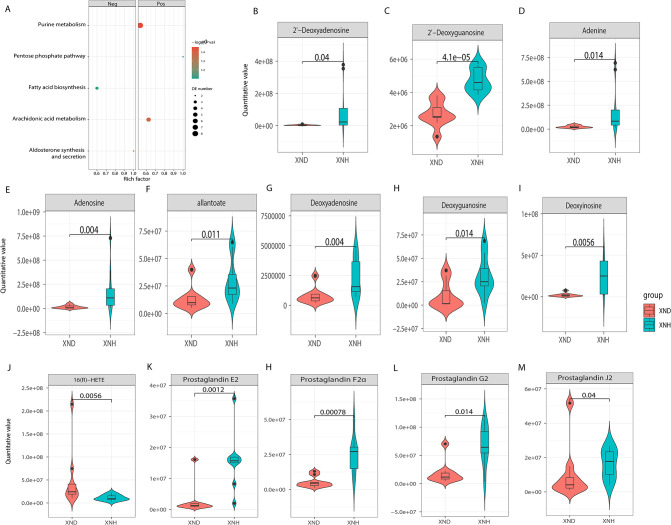
Fig 4.
Analyses of differentially expressed metabolites. (A) Kyoto Encyclopedia of Genes and Genomes (KEGG) pathway analyses of DE metabolites using the positive or negative ion model. (B–I) Violin plot shows quantitative abundance level of the metabolites in purine metabolism. (J–M) Violin plot shows quantitative abundance level of the metabolites in arachidonic acid metabolism.

