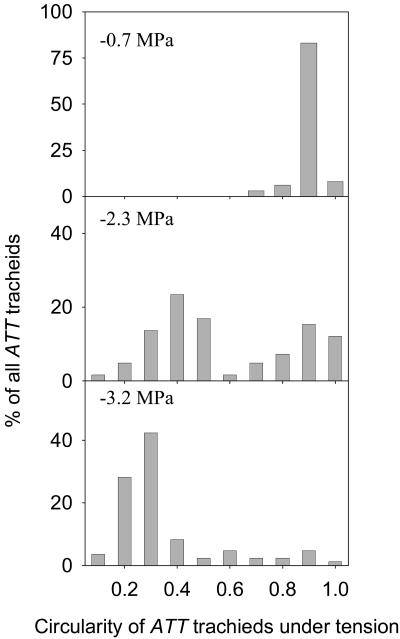
Figure 2.
Distributions of ATT tracheid cross-sectional geometry using a circularity index (C) that describes perfectly round cells as 1 and approaches zero as cells become flattened. At low tension (−0.7 MPa) nearly all cells were round while at high tension (−3.2 MPa) cells were mostly flattened. At intermediate tensions (−2.3 MPa) the frequency distribution of tracheid circularity was always strongly bimodal with 75% of cells either round (C ≥ 0.8) or strongly flattened (C ≤ 0.4). The three distributions shown are from representative leaves at the pressures shown (n = 140–150 tracheids/leaf).

