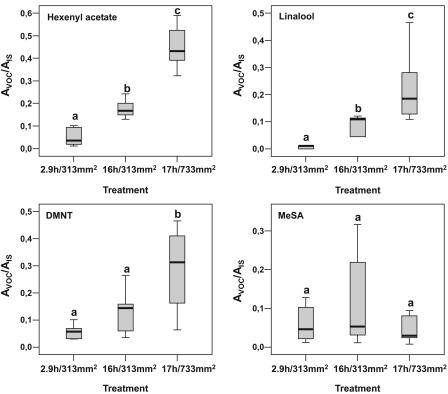
Figure 4.
Relative amounts of various emitted VOCs in relation to time and extent of mechanical treatments in lima bean leaves. Volatiles have been induced by either mechanical damage of a fixed area at various or similar lengths of time combined with various areas. The relative increase or decrease in the amount of volatiles was determined by the ratio of the peak area of the particular compound (AVOC) to the peak area of the internal standard (AIS). Statistical evaluations were done with SPSS (version 11.5). Different letters indicate significant differences between treatments (P < 0.05) according to one-way ANOVA on rank-transformed data. The Student-Newman-Keuls test was used to determine post hoc differences. Sample sizes are n = 5 (2.9 h, 313 mm2), n = 6 (16 h, 313 mm2), and n = 10 (17 h, 733 mm2).

