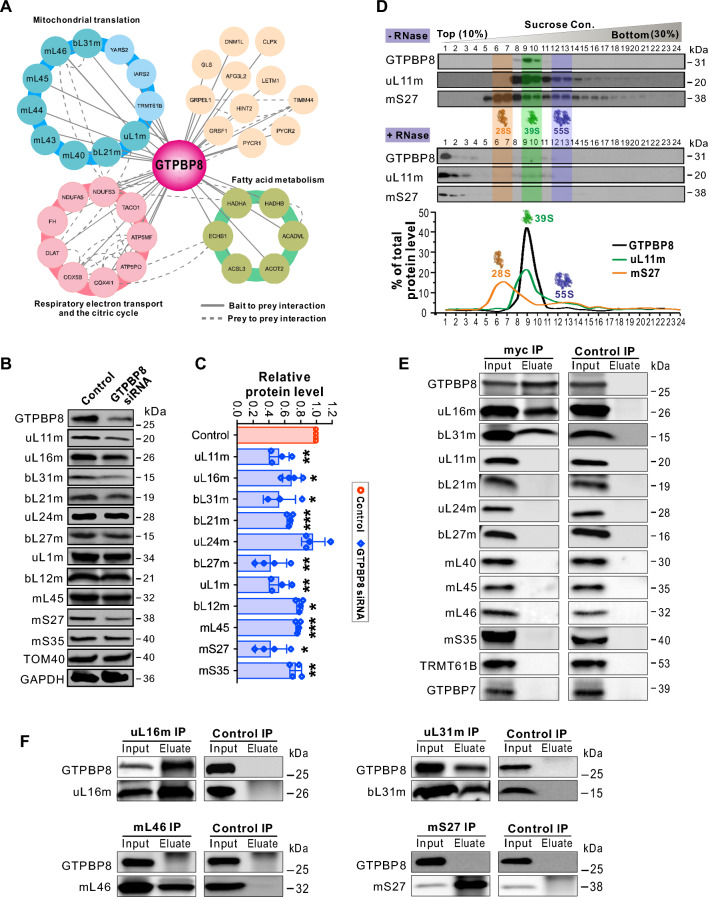
Fig. 4.
GTPBP8 associates with the large mitoribosomal subunit. A The comprehensive interactome of GTPBP8 using a proximity-dependent biotin identification (BioID) analysis. The protein complex/functional groups were indicated by different colors. The mitoribosomal large subunit (mt-LSU) proteins are highlighted in cyan. Bait to bait interactions are shown with solid lines, and prey-to-prey interactions are shown with dashed lines. B Steady state levels of mitoribosomal proteins after GTPBP8 depletion. C Quantification of the steady state levels of mitoribosomal proteins in panel B. The protein level was normalized to TOM40. Error bars represent the mean ± SD of three independent repetitions. *P ≤ 0.05, **P ≤ 0.01, and ***P ≤ 0.001, Student’s t-test. D Sucrose gradient sedimentation profile of GTPBP8 compared with the mt-LSU protein uL11m and small subunit protein mS27. RNAase-treated samples are in the lower panel. The mt-SSU, mt-LSU, and monosome fractions are highlighted by yellow, green, and purple, respectively. E, F Co-immunoprecipitation analysis of GTPBP8-associated proteins using antibody-coated Protein G Dynabeads™. U2OS cells transfected with GTPBP8-myc for 48 h were used for the co-immunoprecipitations. The input and eluate fractions were analyzed by SDS-PAGE followed by immunoblotting with the indicated antibodies

