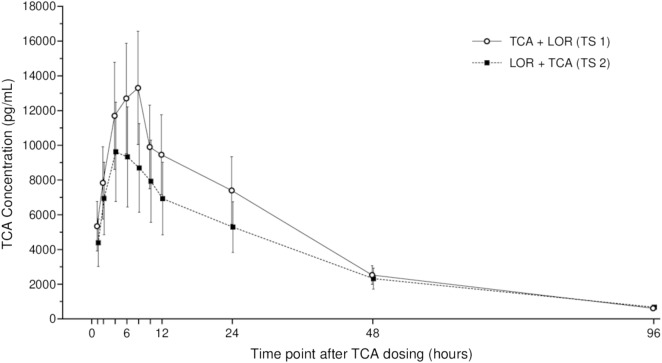
Fig. 3.
Plasma concentrations of TCA. All subjects received both study injections, TCA and LOR, in a randomized manner in either TS 1 (TCA then LOR) or TS 2 (LOR then TCA). Data are geometric mean ± geometric standard deviation (SD). Summary statistics were not calculated at any pre-dose time point. For all other summary statistics, values reported as < 20.0 were set to 1/2 × LLOQ (LLOQ = 20.0 pg/mL). TCA triamcinolone acetonide, LOR lorecivivint, LLOQ lower limit of quantification, TS treatment sequence

