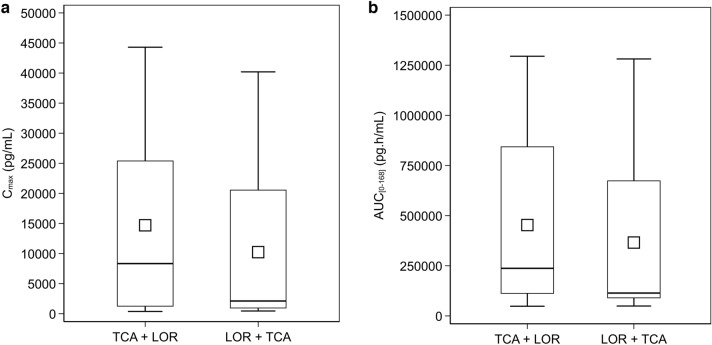
Fig. 4.
Boxplots of individual treatment values by treatment sequence. a Cmax (PKAS). b AUC0–168 (PKAS). All subjects received both study injections, TCA and LOR, in a randomized manner in either Treatment Sequence 1 (TCA then LOR) or Treatment Sequence 2 (LOR then TCA). The boxplots display the minimum, 25th percentile, mean, median (50th percentile), 75th percentile, and maximum observations. The mean is represented by the square and the median is represented by the horizontal line within the box. TCA triamcinolone acetonide, LOR lorecivivint

