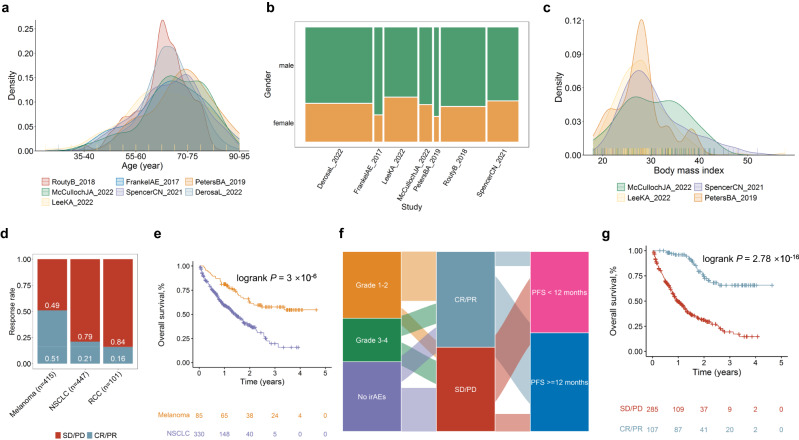
Fig. 2. Clinical characteristics of ICI related datasets.
a Age distribution in these seven studies. b Gender proportions of these seven studies. c Body mass index distribution in four studies with this information available. d Spine plots for response “CR/PR” versus no response “SD/PD”. e Survival curves for OS by cancer types. f Sankey plot for irAEs, response, and whether progression-free survival longer than 12 months. g Survival curves for OS of response “CR/PR” and no response “SD/PD” groups. P values from log-rank tests are shown in survival plots. irAEs immune-related adverse events, PFS progression-free survival, OS overall survival.

