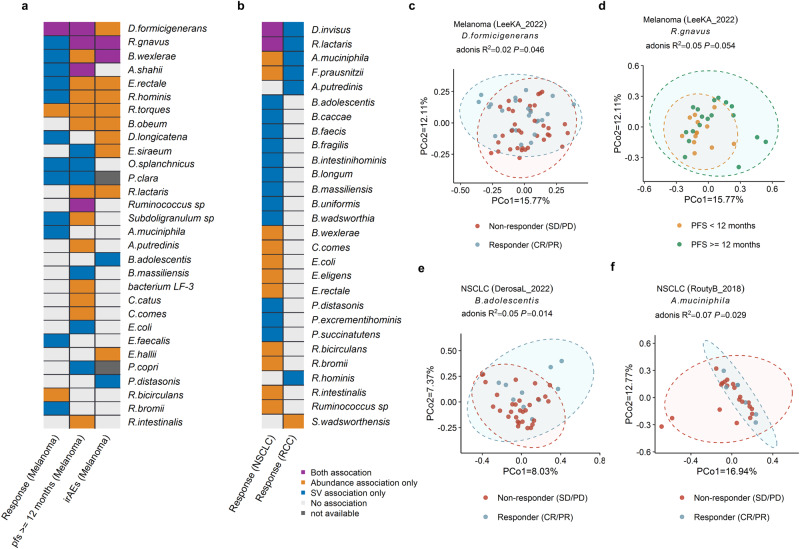
Fig. 4. Associations of gut microbiome with hosts’ response to ICIs at the level of species.
Heatmap of associations between species and hosts’ response to ICIs of melanoma (a), NSCLC and RCC (b). Yellow denotes purely relative abundance associations, blue indicates purely SV-based associations, and purple denotes associations based on both SV and relative abundance. Gray denotes relative abundance-based relationships, in which SV associations for the relevant species were not examined due to the small sample size (n < 10). White denotes a lack of association. c SV association of D.formicigenerans with response of melanoma patients treated with ICIs. d SV association of R.gnavus with PFS12 of melanoma patients. e SV associations of B.adolescentis with response to ICIs of NSCLC. f SV association of A.muciniphila with response of RCC patients treated with ICIs. Two-sided statistical tests were utilized. Please also refer to Supplementary Data 3.

