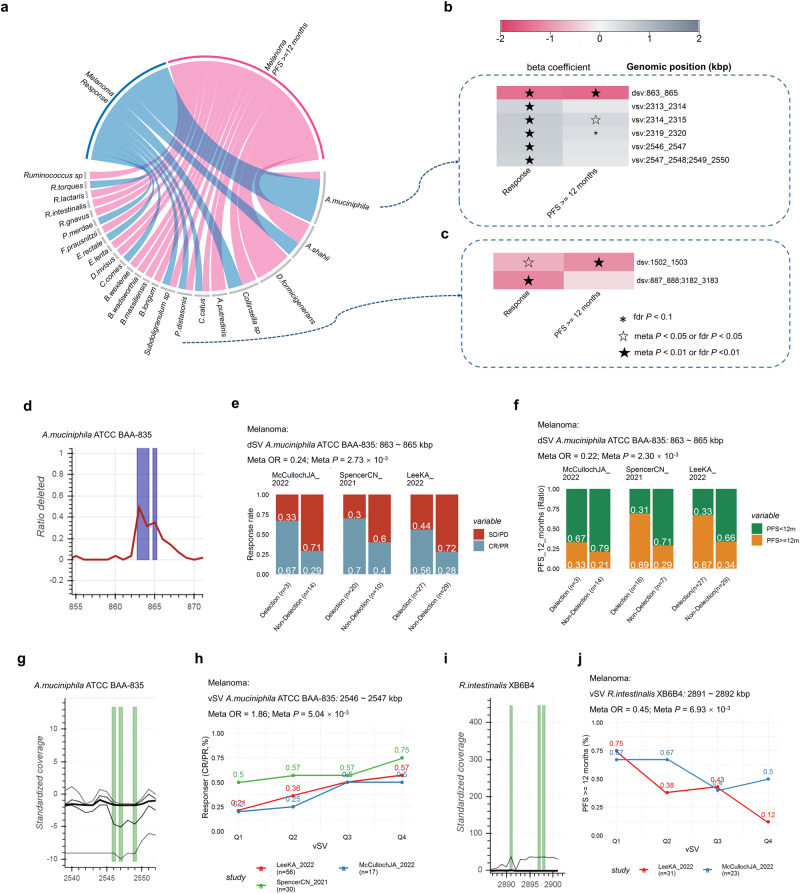
Fig. 5. Associations between structural variants and prognosis after ICIs treatment of melanoma patients.
a Candidate associations between prognosis after ICIs treatment and SVs of melanoma patients. Heatmap of correlations between prognosis after ICIs treatment and SVs of A.muciniphila (b) and P.distasonis (c). d Deletion rate across the cohort (y axis) along a genomic region of A.muciniphila (x axis). Spine plots depict the association between response (e), PFS12 (f), and dSVs within each cohort. g Standardized variability (y axis, plotted lines, percentiles 1, 25, 50, 75 and 99) along a genomic region of A.muciniphila (x axis). h Line plots depict the association between PFS12, and vSV within each cohort (h). i Standardized variability (y axis, plotted lines, percentiles 1, 25, 50, 75 and 99) along a genomic region of R.intestinalis (x axis). j Line plots depict the association between response and vSV within each cohort, Q1 to Q4 are defined based on the quantiles of vSV (25%, 50% and 75%). Logistic regression models were performed to calculate beta value (b), ORs and 95% CIs (e, f, h, j) for response and PFS12. Meta-analysis with a random-effect model was performed to integrate the results of different cohorts. Two-sided statistical tests were utilized. No adjustments were made for multiple comparisons. Please also refer to Supplementary Data 4.

