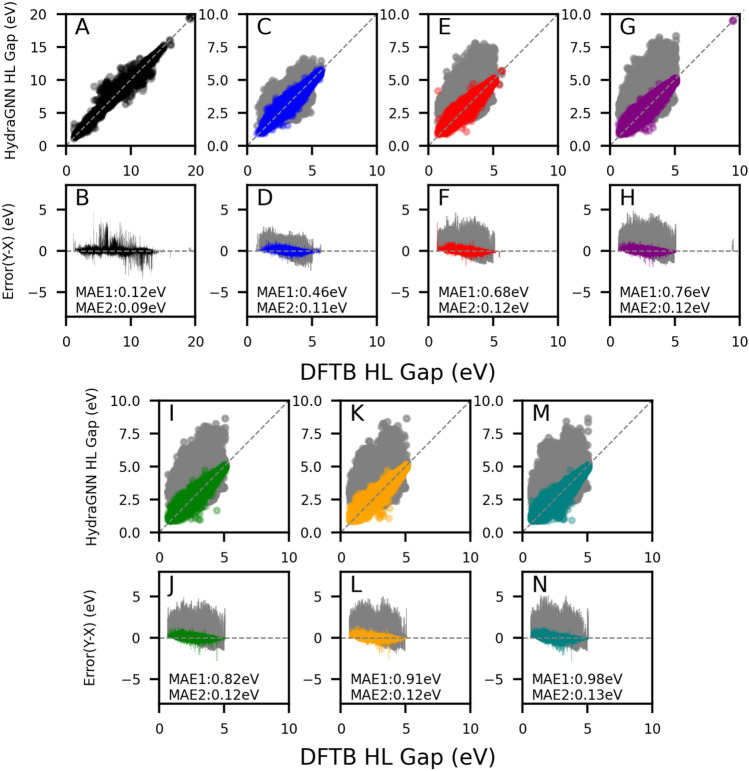
Figure 2.
Parity plots for GDB-9 (A) and iterations 1 to 6 (C,E,G,I,K,M) of Low HL gap design. Error plots between surrogate models and DFTB predictions for each dataset (B,D,F,H,J,L,N) (colored points for the Surrogate5 prediction and gray points for the Surrogate0 prediction). Surrogate5 is trained with GDB-9 and GEN-1–GEN-5 dataset. MAE1 and MAE2 values in each plot are corresponding to the prediction errors of the Surrogate0 and Surrogate5, respectively.

