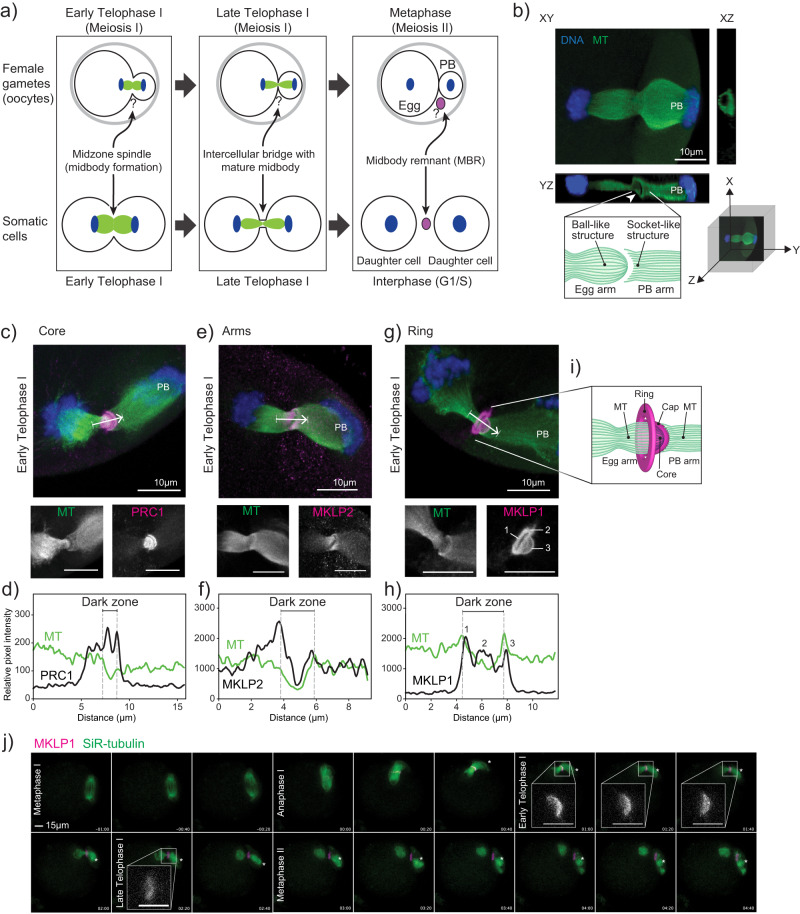
Fig. 1. The meiotic midbody of mouse oocytes contains a cap sub-structure.
a Schematic depicting the distinct processes of meiosis I cytokinesis in oocytes and mitotic cytokinesis. Question marks refer to unknown biology in oocytes. b Representative image of a mouse oocyte early Telophase I with views at XY, XZ and YZ planes. White arrowhead in YZ plane highlights the tubulin asymmetry (ball-like structure and socket-like structure); polar body (PB). Below confocal images are a 3D coordinate system and schematic of the observations. c, e, g Representative z-plane projected confocal images showing localization of representative markers for the three main midbody regions (magenta in merge; PRC1, MKLP2 and MKLP1) relative to microtubules (green in merge; alpha-tubulin) and chromosomes (blue in merge; DAPI). White arrows indicate direction of line scan plots in d, f, and h. The numbers in the MKLP1 zoom panel correspond to the three peaks in the line scan in (h). d, f, h) Intensity line scan plots for microtubules (green) and corresponding protein (black) of images in c, e, g. Gray dotted lines demark the beginning and end of the midbody dark zones. i) Schematic representation of the meiotic midbody and cap in oocytes. j) Representative still images from confocal live-cell imaging of oocytes, expressing MKLP1-GFP (magenta) and incubated with SiR-tubulin (green). Stages of meiosis are labeled. Timepoint 00:00 represents the beginning of Anaphase I onset. Four zooms of early and late Telophase I time points highlight the cap formation and regression. All experiments were conducted three times. Asterisk marks the PB. Zoom scale bars = 5 µm.

