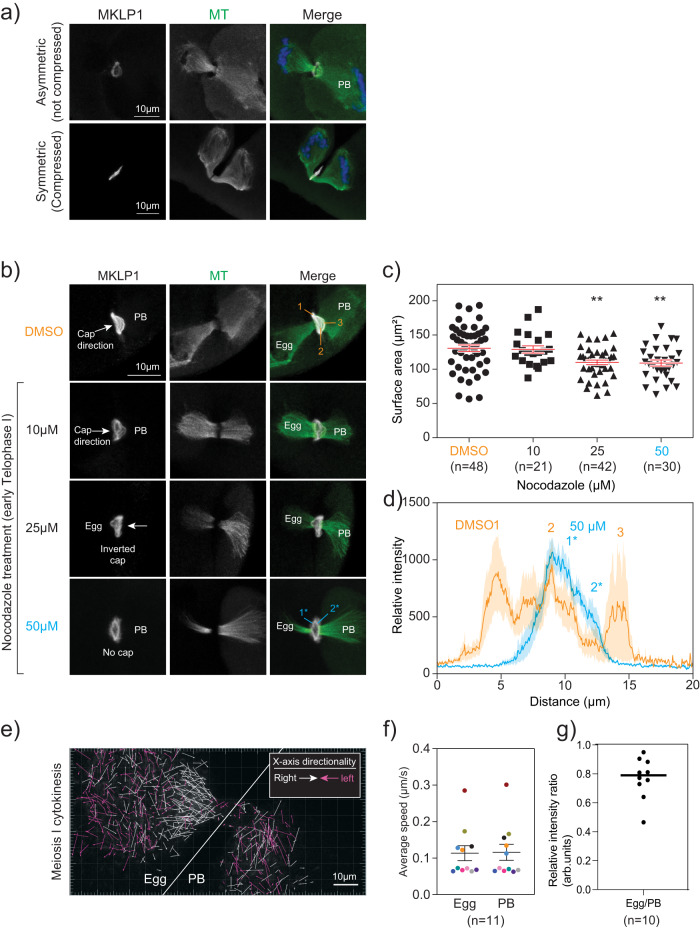
Fig. 3. Microtubules are required to form the meiotic midbody cap.
a Comparison of the mMB cap structure (MKLP1, gray) and microtubules (green; tubulin) when oocytes undergo asymmetric (top panels) or symmetric (bottom panels) divisions. PB = polar body b Representative confocal images of nocodazole dose-dependent distortion and reduction in the mMB cap (MKLP1; gray) and midzone spindle (tubulin; green). The regions of MKLP1 numbered are the peaks detected in line scans in (d) and the arrows indicate the direction of the cap bulge. c Quantification of surface area occupied by ring after nocodazole treatment. One-way ANOVA; 3 replicates; number of oocytes in DMSO: 48, 10 µM: 21, 25 µM: 42, 50 µM: 30; **p = 0.0014 (25 μM) and 0.0026 (50 μM). d Line scan plots of MKLP1 intensity from control (orange) and nocodazole-treated (blue) oocytes in (b). Shading reflects the standard error of the mean. The numbers reflect the numbers labeled in the corresponding images. e–g Comparison of microtubule polymerization and dynamics during early telophase I by confocal live-cell imaging of oocytes expressing EB3-GFP. e Representative still image from live-cell confocal imaging of oocytes undergoing cytokinesis and expressing EB3-GFP. X-axis directionality of arrows towards left (pink) and right (white) are colored coded in (e). Single z-plane was selected based on clear visualization of the dark zone in oocytes with the midzone spindle oriented parallel to the imaging plane. White line delineates the egg (left) and PB (right) sides. f Average speed of EB3-GFP puncta in egg versus PB; 11 oocytes. Data points collected from the same dividing oocyte are color-matched. g) Relative EB3-GFP intensity ratio in PB compared to egg. Unpaired Student’s t-test, two-tailed; 10 oocytes; ** p < 0.01, **** p < 0.0001. Data are presented as mean values +/- SEM. arb. units = arbitrary units.

