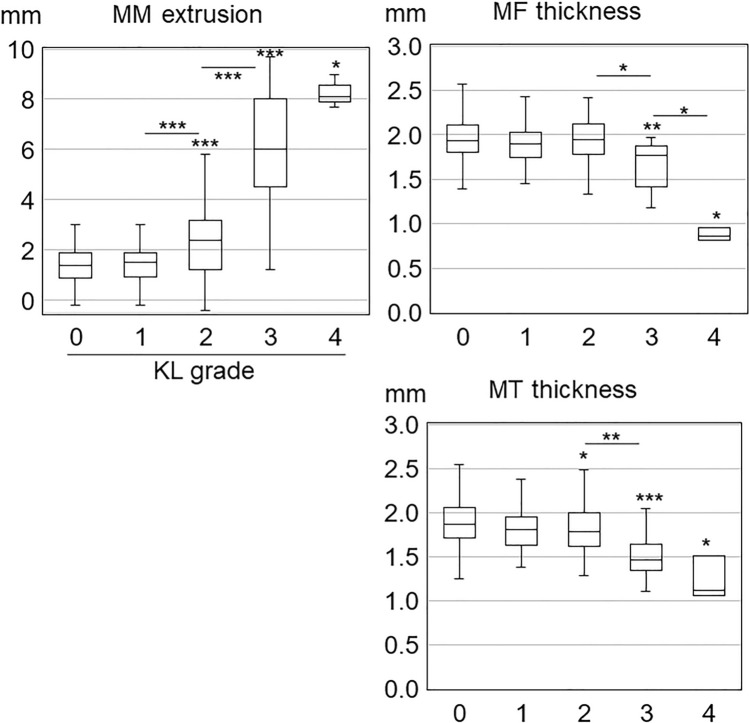
Figure 3.
Association of Kellgren–Lawrence grade with medial meniscus extrusion width and cartilage thickness in the medial femoral and the medial tibial regions. The center line in each box plot indicates the median value, the boxed area indicates the interquartile, and the whiskers extend from either side of the box to show the minimum and maximum values (or 1.5 times the interquartile range if the minimum or maximum values fall outside this range). Asterisks over the box plots indicate p-values of multiple comparisons by the Steel–Dwass test with KL grade 0 after the Kruskal–Wallis test. Asterisks between adjacent box plots indicate the p-values of multiple comparisons by the Steel–Dwass test after the Kruskal–Wallis test. *p < 0.05, **p < 0.01, ***p < 0.001.

