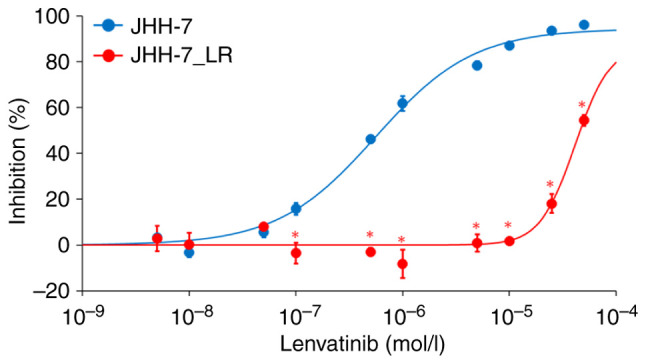
Figure 1.

Inhibition of JHH-7 and JHH-7_LR cell proliferation by lenvatinib. Each symbol and vertical bar represent the mean and standard deviation, respectively (n=3). Solid lines are the fitted lines using the least squares method. *P<0.01 vs. JHH-7 cells.
