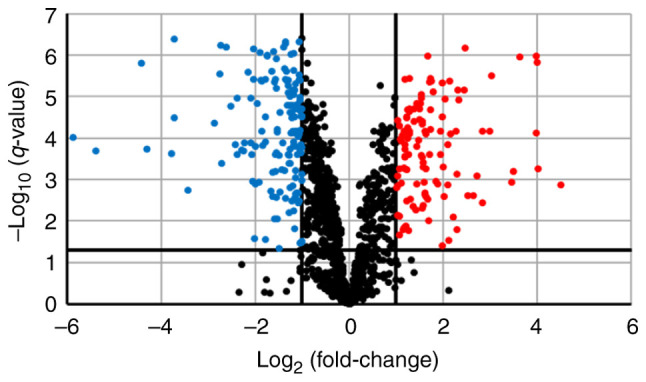
Figure 2.

Fluctuations in protein expression levels associated with the development of resistance. Volcano plot showing the relationship between the magnitude of protein expression change [log2 (fold-change); x-axis] and statistical significance of this change [-log10 (q-value); y-axis] in a comparison of JHH-7 and JHH-7_LR cells. Red dots (n=115) indicate proteins that were significantly increased by a factor of ≥2 (q<0.05). Blue dots (n=152) indicate proteins that were significantly decreased by a factor of ≥2 (q<0.05).
