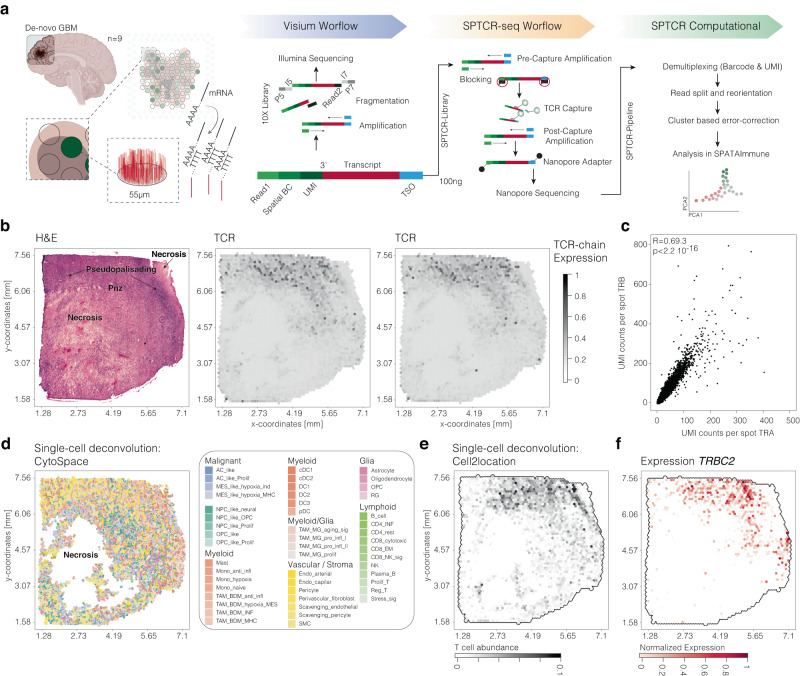
Fig. 1. Overview of the SPTCR workflow.
a Illustration of the workflow combining spatially resolved transcriptomics with T cell receptor profiling in the SPTCR-seq protocol. Independent from the standard Visium protocol, the yield of 100 ng full-length cDNA is taken to enrich TCR transcripts through hybridization. After long-read sequencing on the nanopore platform, intensive postprocessing is applied and data will be integrated through the R-based software tool SPATAImmune. b H&E histological image of the sample UKF313 with annotation of defined histological regions. Surface plots indicate the abundance of TCR chains. c Scatter plot of TRA UMI counts per spot (y-axis) and TRB UMI counts per spot (y-axis). Pearson correlation R = 0.693, p < 2.2 × 10⁻¹⁶. d Surface plot of the single-cell composition after deconvolution with CytoSPACE22. Surface plot of the T cell abundance using Cell2Location scores (e) or the expression of TRBC2 (f). Surface plots contain the dimensions of the samples (in mm) on the x and y axes. Partially created with BioRender.com.

