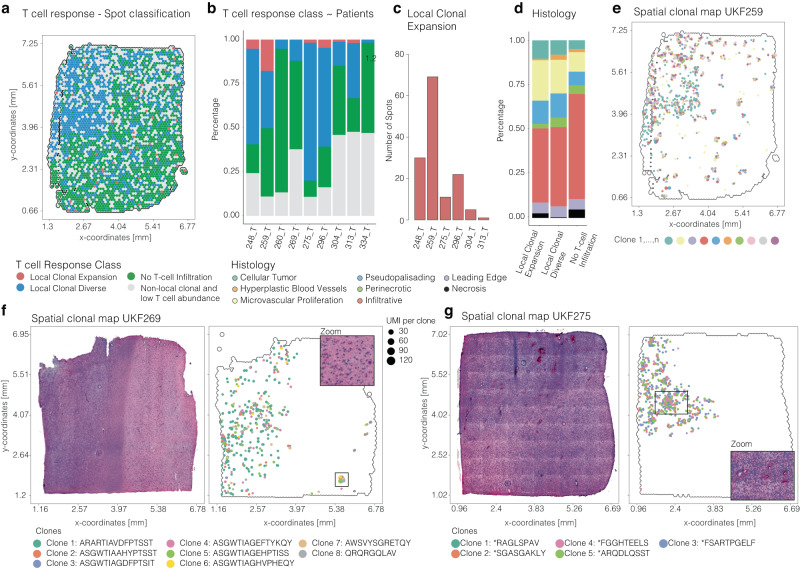
Fig. 5. Clonal annotation and single T cell clone visualization.
a Representative example of the sample UKF259. Colors indicate the TCR label of the spot. b Stacked barplot of the distribution of T cell response classes (indicated by colors) across samples. c Barplot of the number of spots classified as clonal. d Stacked barplot of the distribution of histological groups across T cell response classes. e–g Surface plots with histology (left) and spatial mapping of single clones. Surface plots contain the dimensions of the samples (in mm) on the x and y axes.

