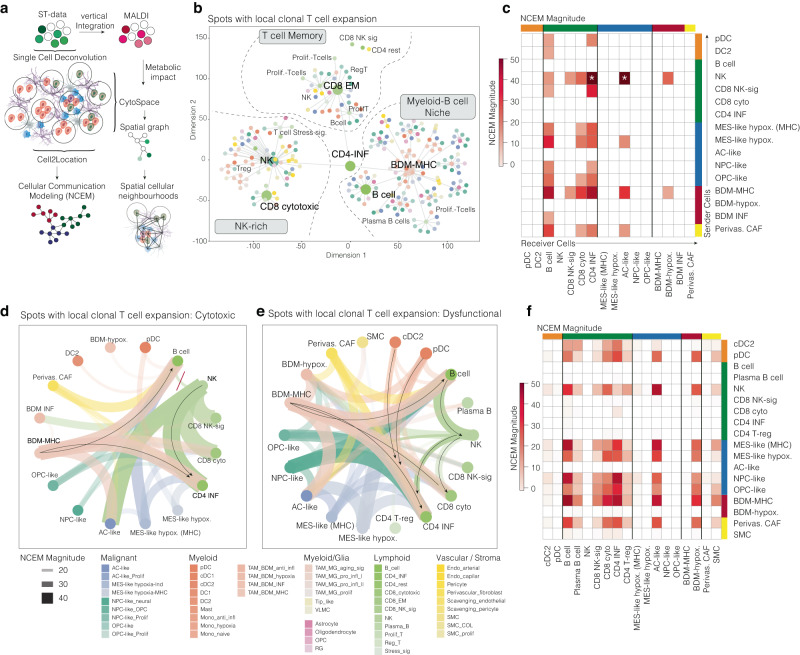
Fig. 6. Neighborhood analysis of exhausted and cytotoxic T cell clones.
a Illustration of the spatial cell communication modeling workflow. b Hierarchical graph model of the likelihood of spatial cellular co-existence in spots with local T cell expansion. Cells are presented as nodes and the size represents hub cells in the network. Edges indicate the likelihood of cellular proximity. c Heatmap of the NCEM with sender cells (rows) and receiver cells (cols) in cytotoxic regions. d, e Circle plot of the NCEM graph for cytotoxic areas (left) and dysfunctional/exhausted areas (right). Colors indicate the cell types. The size of the edges indicates the magnitude of the cell-cell communication. f Heatmap of the NCEM with sender cells (rows) and receiver cells (cols) in exhausted regions. Surface plots contain the dimensions of the samples (in mm) on the x and y axes. Partially created with BioRender.com.

