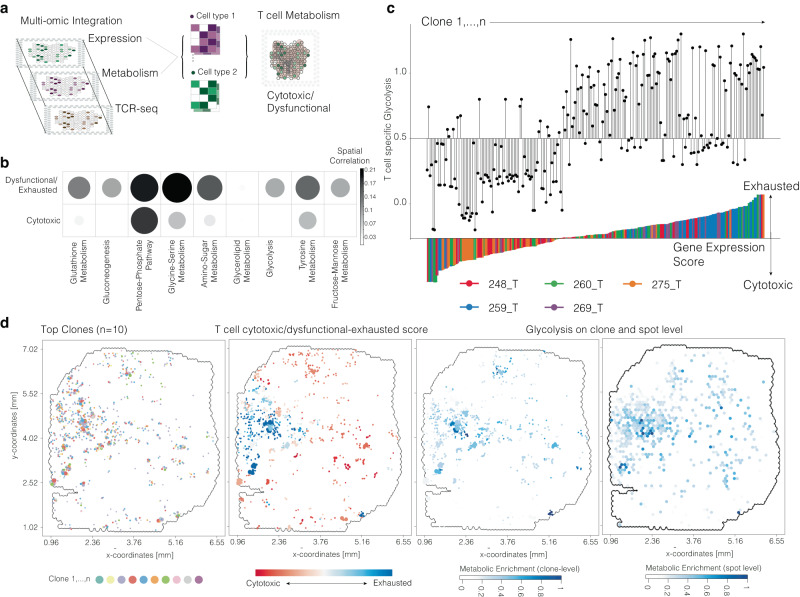
Fig. 8. Multi-omic annotation of T cell metabolism.
a Illustration of the workflow for integration of metabolic and transcriptional data. b Dotplot for correlation between transcriptionally defined T cell exhaustion/cytotoxic behavior and abundance of metabolites from various pathways. c Illustration of glycolysis (top) and the exhaustion/cytotoxic score (bottom) at clone level. All spots occupied by a clone are summarized for the clonal profile. d Surface plots of an example sample with the abundance of clones (from left to right), the exhaustion/cytotoxic score, and the abundance of glycolysis metabolites on clone- and spot-level (right). Surface plots contain the dimensions of the samples (in mm) on the x and y axes.

