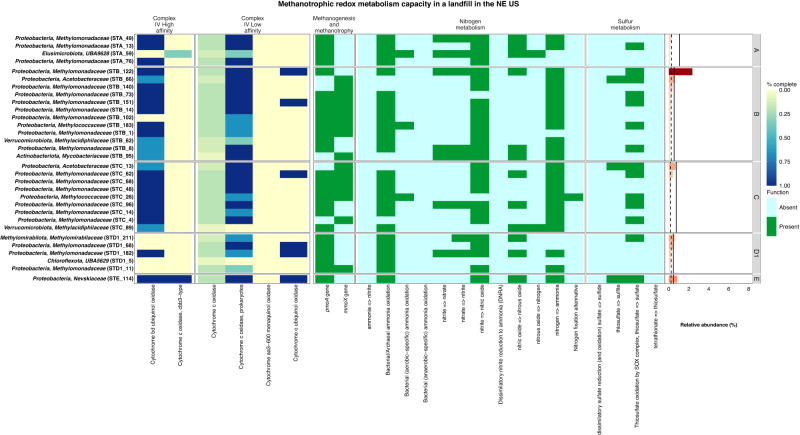
Fig. 5. Metabolic heatmap and relative abundance data for putative methanotrophic metagenome-assembled genomes (MAGs).
Shown here is the completion of high and low-affinity complex IV machinery involved in reducing oxygen alongside the presence/absence of genes involved in methane metabolism, nitrogen metabolism, and sulphur metabolism. No putative methanotroph MAGs were recovered from locations D2, F1, and F2, and as such no panels for those sampling locations are shown. Relative abundance values have been scaled to the most abundant MAG classified to a methane cycling guild. Solid black vertical lines denote the mean relative abundance calculated for MAGs at the whole-community level and dashed black lines denote the median relative abundance calculated for MAGs at the whole-community level. Source Data are provided as a Source Data file.

