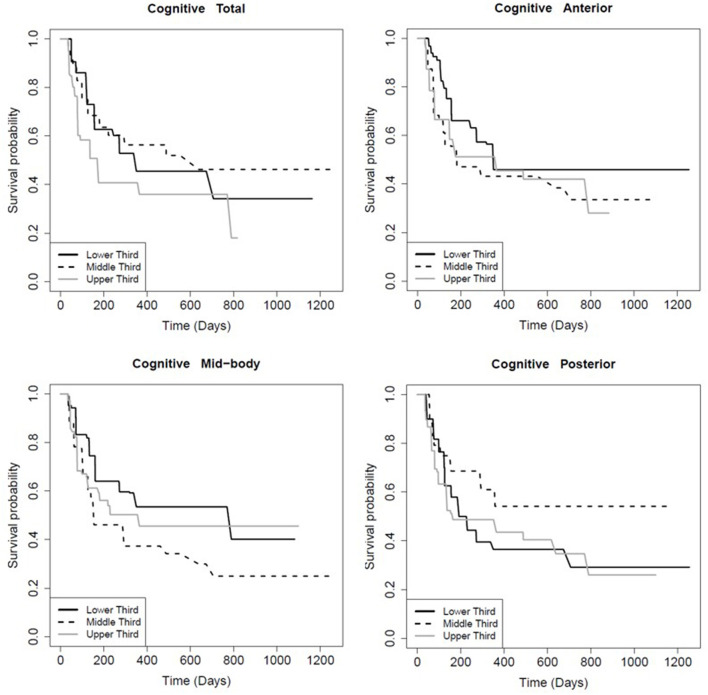
Figure 2.
Kaplan-Meier survival curve showing the longevity of post-concussive cognitive deficits for patients in the upper (highest FA), middle, and lower (smallest FA) third of CC FA values, total and by region as indicated. The Y-axis is the percent of patients reporting symptom persistence at a given time point post-injury. Supporting statistics in Table 5.

