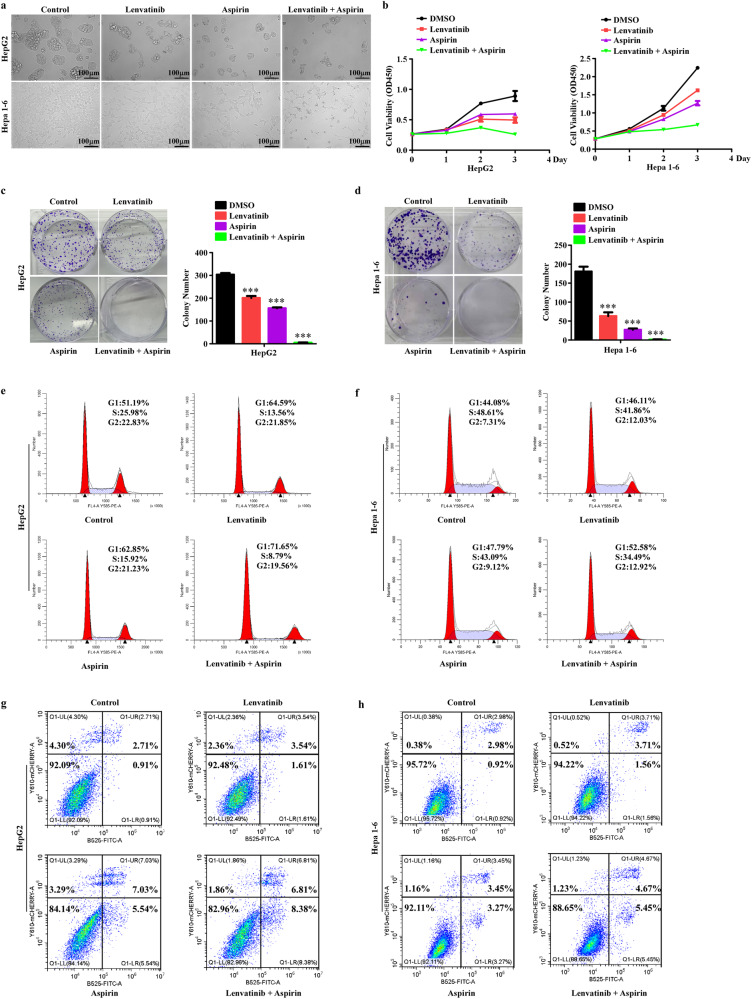
Fig. 3. Aspirin plus lenvatinib exert stronger antitumor effects in HCC cells than monotherapy.
a Representative images of HepG2 and Hepa1-6 cells treated with different drugs. b CCK8 assays reveal cell growth curves of HepG2 and Hepa1-6 cells treated with different drugs. c, d Representative images (left) and relative quantification (right) for the colony formation assays of HepG2 (c) and Hepa1-6 (d) cells treated with different drugs. e, f Cell cycle detection assays analyze the effects mediated by different drugs on the proliferation of HepG2 (e) and Hepa1-6 (f) cells. g, h Cell apoptosis detection assays reveal the effects of different drugs on apoptosis induction in HepG2 (g) and Hepa1-6 (h) cells. Error bars represent the means of three independent experiments. *P < 0.05, **P < 0.01, ***P < 0.001. Aspirin, 4 mM; lenvatinib, 10 μM.

