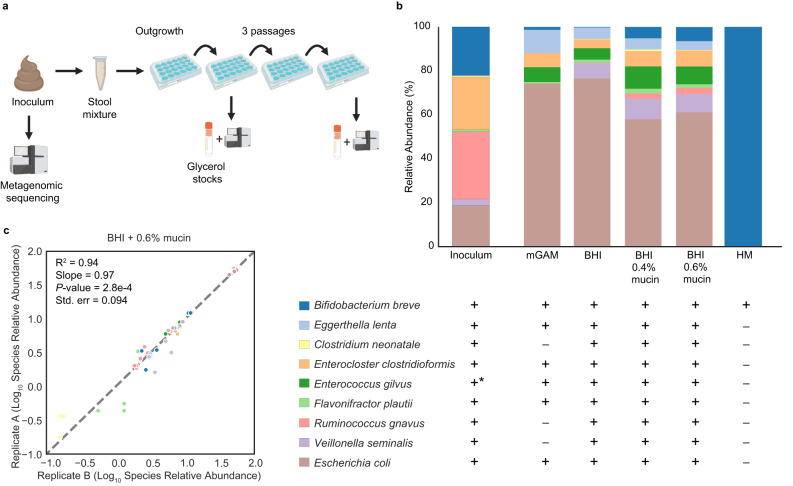
Fig. 1. FT-1 microbiome cultivation overview.
a Microbiome cultivation experimental setup. The frozen pilot infant fecal sample was resuspended in a phosphate-buffered saline (PBS) solution before inoculating it into anaerobic media. After an initial 48-hour outgrowth period, the enrichments were subsequently passaged every 48 h for a total of three passages. A fraction of the enrichment was harvested from the 1st and the 3rd passaged enrichments for metagenomic sequencing and long-term storage. Figure created with BioRender. b Microbiome compositions grown on different complex media after one passage. Bar height represents normalized species relative abundance, and bars are colored by species. The x-axis represents the growth media, and the data are the averages of all replicates. One biological set (n = 3) was run for modified Gifu anaerobic medium (mGAM), brain–heart infusion (BHI), and human breast milk (HM). Three and four independent biological replicates (n = 2 or 3 for each independent experiment) were run for BHI + 0.4% mucin and BHI + 0.6% mucin, respectively. “+” and “−” represent the presence and absence, respectively, of the organism detected in the initial FT-1 inoculum. “*” indicates E. gilvus was below the detection limit in the initial inoculum and its presence was detected through cultivating in non-HM-rich media. c Pairwise species relative abundance comparison among technical replicates. Correlations were calculated using the two-sided linear least-squares regression. Only species in both technical replicates were considered when calculating correlation metrics (R2, slope, P-value, and standard error). Source data are provided as a Source Data file.

