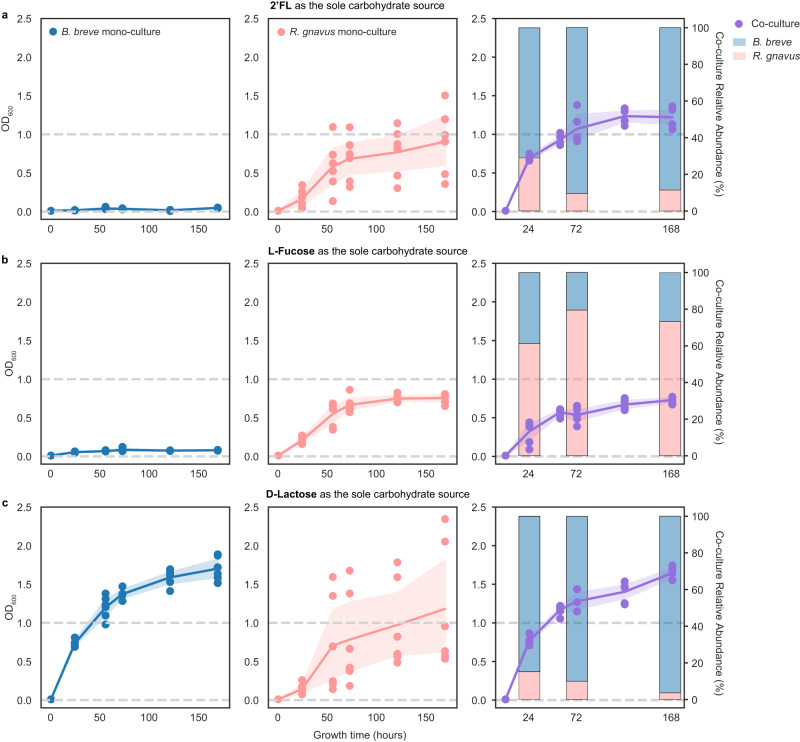
Fig. 4. Mono- and co-culture growth on 2’FL, l-fucose, and d-lactose.
B. breve (blue) and R. gnavus (pink) monocultures and cocultures (purple) grew in media in which 2’FL (a), l-fucose (b), or d-lactose (c) was the only carbohydrate source. The x-axis represents the growth time (in hours). The left y-axis represents OD600, and the right y-axis in the co-culture panels represents the normalized relative abundance, calculated using sequencing coverage and shown as the averages of all replicates (n = 6). The experiment was done in triplicates and was repeated once. Each circle represents a mono- or co-culture replicate sample and the line represents the average of all replicates at each time point; error bands indicate the 95% confidence interval. The relative abundance of each species (B. breve or R. gnavus) at the 24th, 72nd, and 168th hours was shown in stacked bar charts in less saturated colors in the co-culture panels. Source data are provided as a Source Data file.

