
Central illustration. Measured and predicted PPM after TAVR.
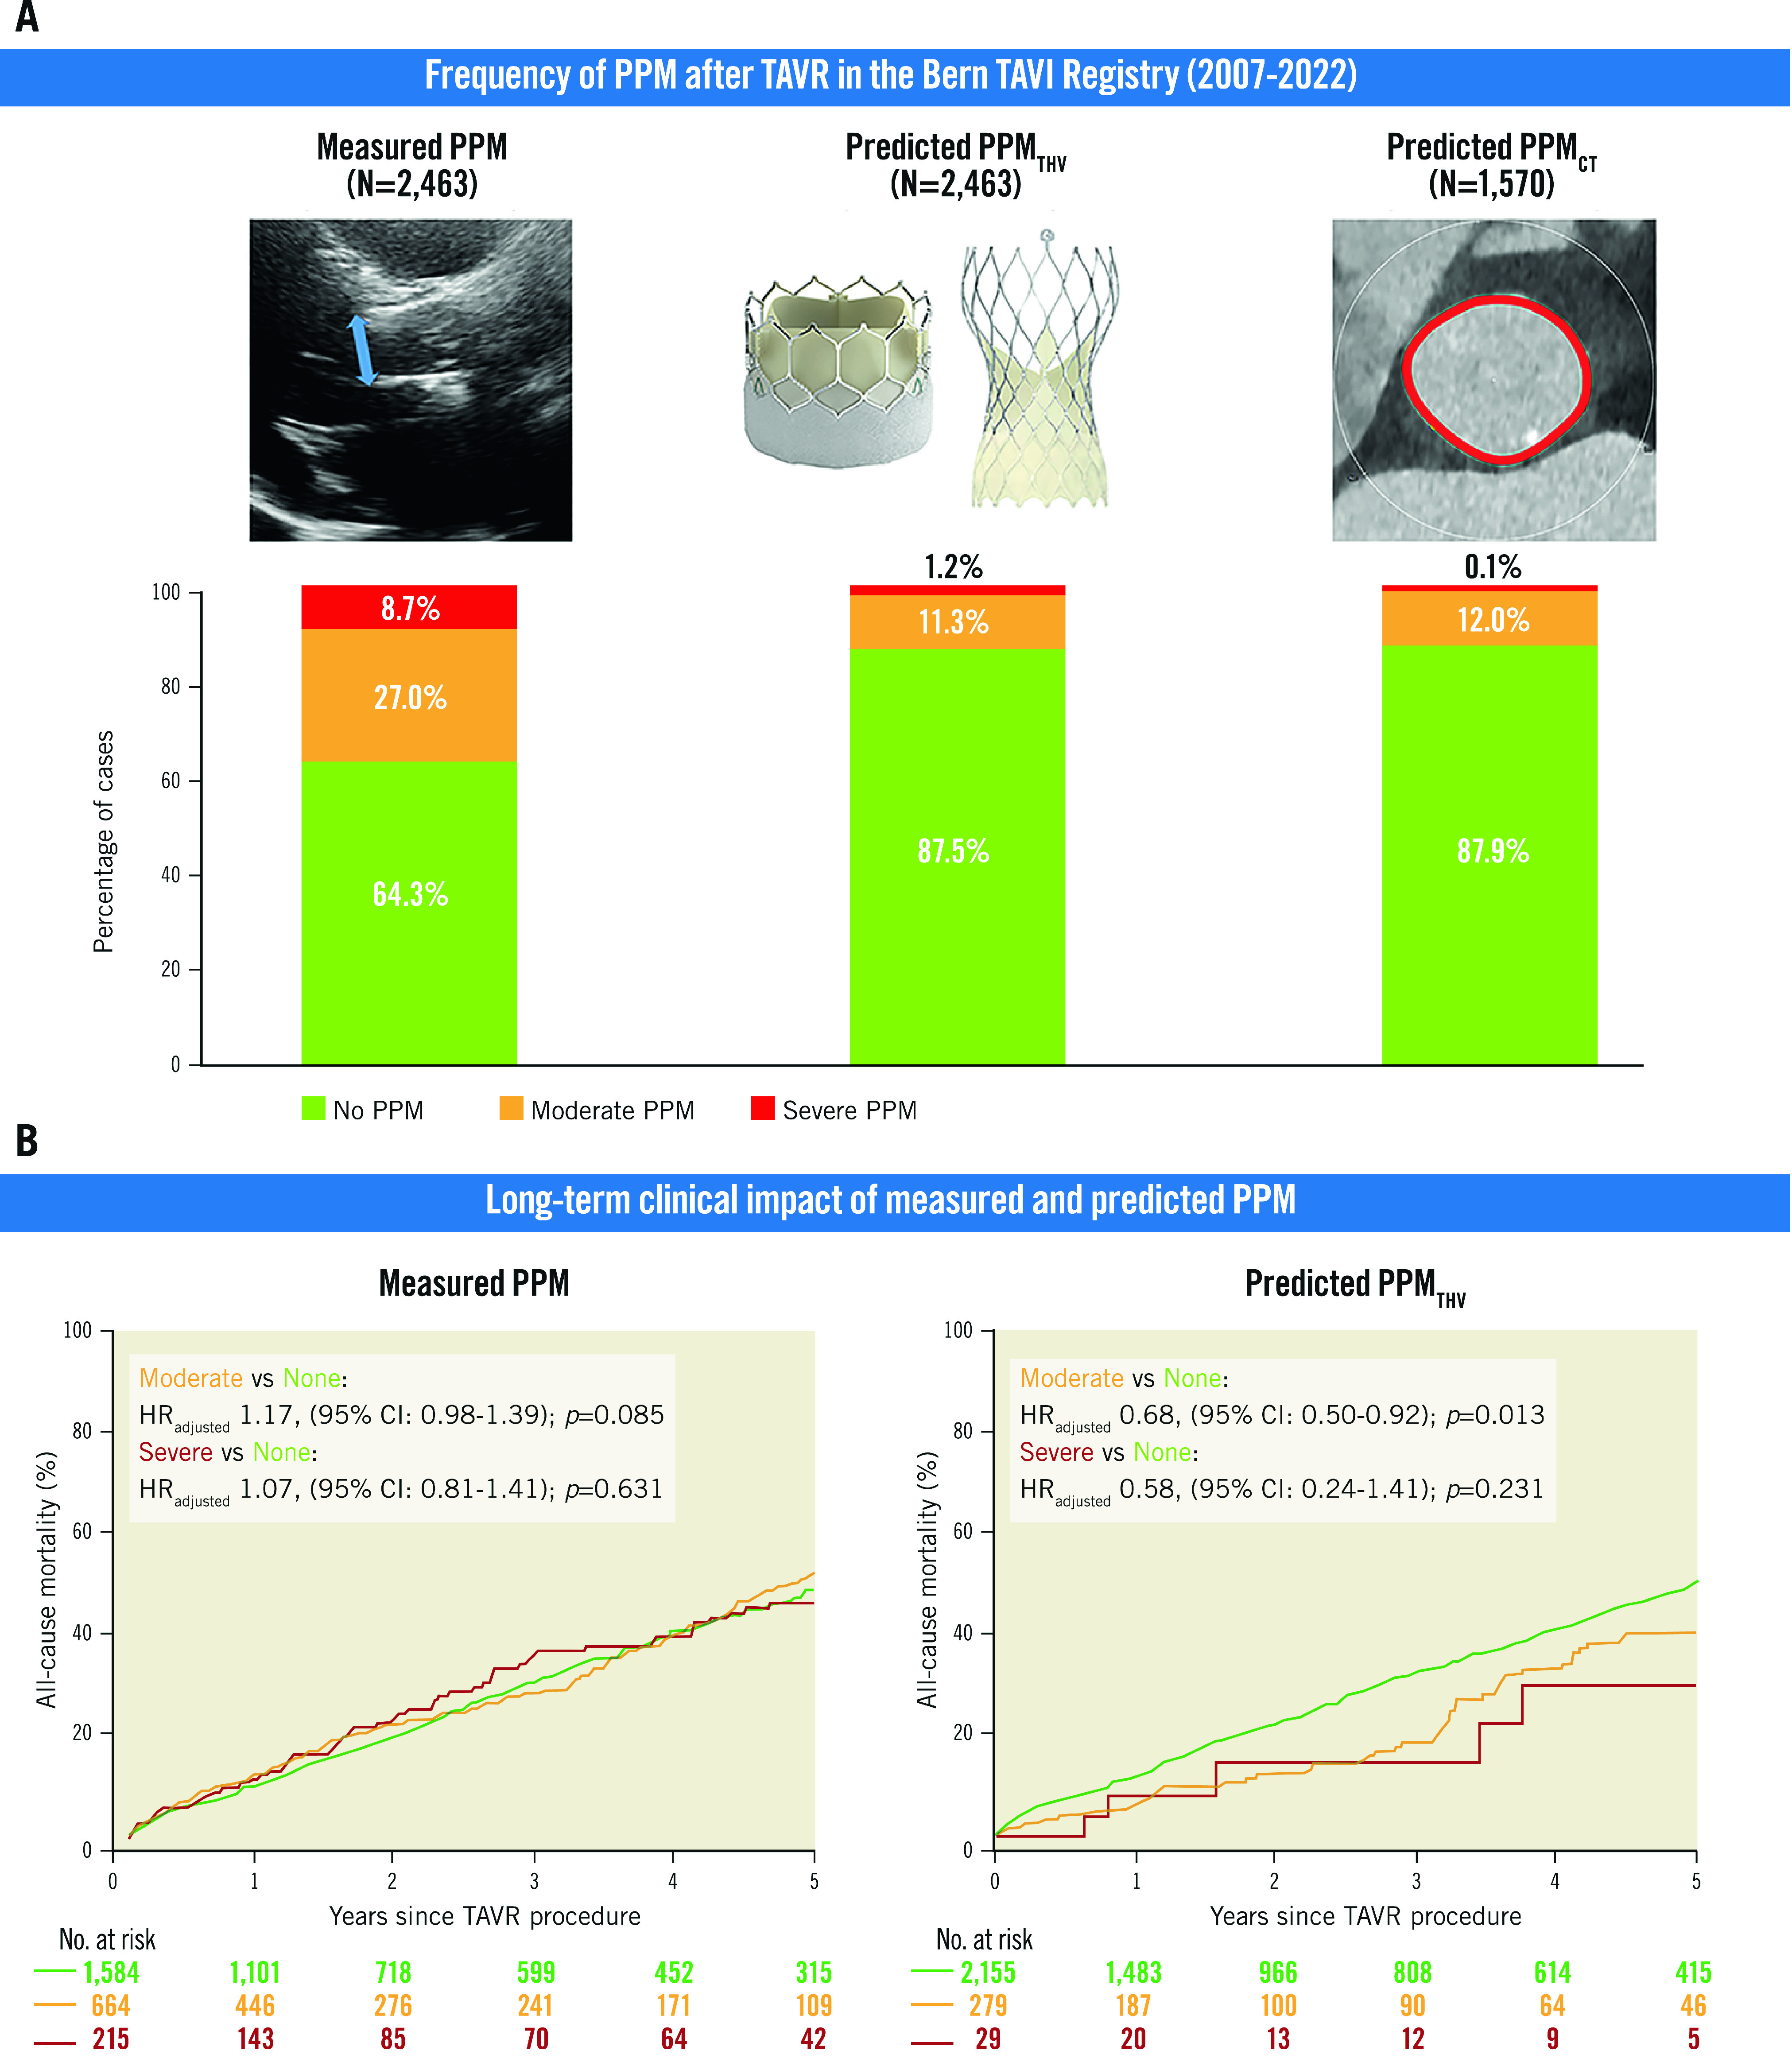
Frequency of PPM according to type and severity after TAVR (A), and cumulative event curves for all-cause mortality according to type and severity of PPM (B). Hazard ratios and p-values were calculated with the use of Cox proportional hazards models. CI: confidence interval; EOA: effective orifice area; HRadjusted: adjusted hazard ratio; PPM: prosthesis-patient mismatch; PPMCT: PPM defined by the normal reference values of EOA derived from aortic annulus area/perimeter measured by preprocedural computed tomography; PPMTHV: PPM defined by the normal reference values of EOA for each size and model of implanted transcatheter heart valve; TAVR: transcatheter aortic valve replacement; THV: transcatheter heart valve