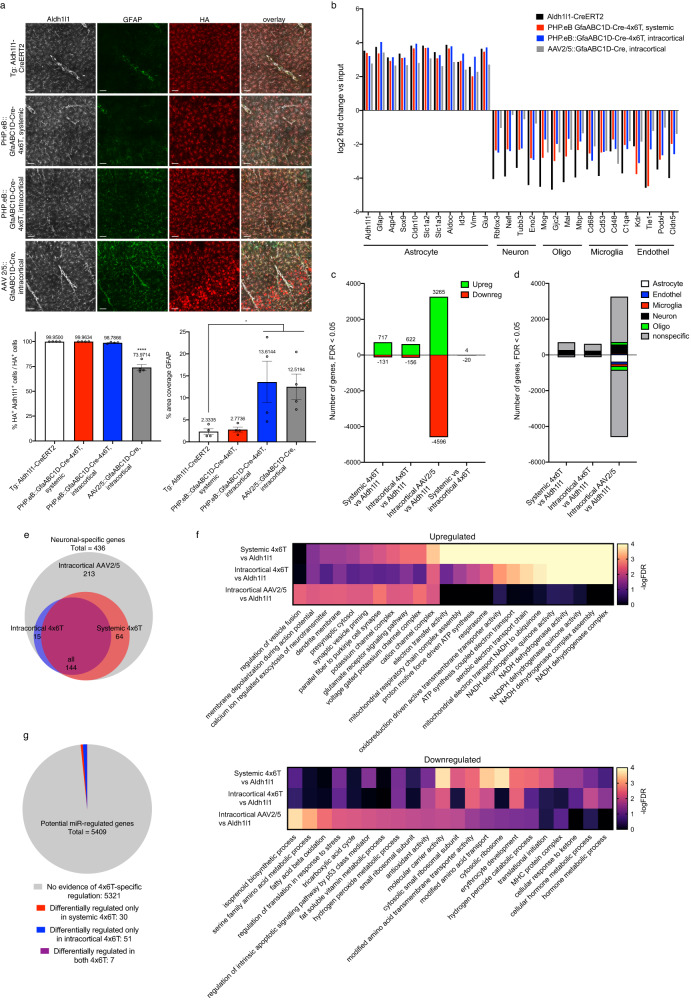
Fig. 5. Transcriptional analysis of astrocytes with viral transduction with and without 4x6T cassette (TRAP).
a Immunohistochemical analysis of RiboTag+ cells (hemagglutinin HA+ ribosomal tag), colocalized with astrocytic marker Aldh1l1 and astrocytic reactivity marker GFAP. Astrocytic specificity is high in Aldh1l1-CreERT2 transgenic mice and systemic delivery of PHP.eB::GfaABC1D-Cre-4x6T with no overt evidence of astrocyte reactivity (GFAP% coverage). Specificity remains high with intracortical delivery of PHP.eB::GfaABC1D-Cre-4x6T and decreases with intracortical delivery of AAV2/5::GfaABC1D-Cre; this route of viral delivery shows some evidence of astrocyte reactivity by GFAP immunoreactivity. Scale bars: 50 μm. Mean ± SEM; n = 4 mice per cohort. Astrocyte specificity, HA+Aldh1l1+/HA+: one-way ANOVA, Holm–Sidak’s multiple comparisons test, P < 0.0001, F = 77.01, df=15; Aldh1l1-CreERT2 vs AAV2/5::GfaABC1D-Cre ****P < 0.0001. GFAP % area coverage: Aldh1l1-CreERT2 = 2.33% coverage ± 0.64; PHP.eB::GfaABC1D-Cre-4x6T systemic, 2.77% coverage ± 0.55; PHP.eB::GfaABC1D-Cre-4x6T intracortical, 13.61% coverage ± 4.71; AAV2/5::GfaABC1D-Cre, 12.52% coverage ± 2.90; one-way ANOVA, Holm–Sidak’s multiple comparisons test, P = 0.0011, F = 10.54, df=15; Aldh1l1-CreERT2 vs PHP.eB::GfaABC1D-Cre-4x6T intracortical *P = 0.0431; Aldh1l1-CreERT2 vs AAV2/5::GfaABC1D-Cre *P = 0.0481. Source data are provided as a Source Data file. b Relative levels of enrichment and de-enrichment of canonical genes for astrocytes, neurons, oligodendrocytes, microglia, and endothelial cells in IP-vs-input samples. c Differentially expressed genes in IP samples: different viral cohorts vs Aldh1l1-CreERT2 IP samples, and systemic vs cortical 4x6T samples. FDR < 0.05, average FPKM across all IP samples >1. d Cell-type specificity of differentially expressed genes in IP samples: genes in (c) that are represented in the top 1000 specific genes for astrocytes, endothelial cells, microglia, neurons, or oligodendrocytes. e Venn diagram showing the overlap of which neuron-specific genes from (d) are upregulated in different viral cohort IP samples vs Aldh1l1-CreERT2 samples. f Top ten most significantly upregulated and downregulated Gene Ontology gene sets (FDR < 0.05) in ranked IP transcriptomes of each of the viral cohorts, calculated with Gene Set Enrichment Analysis; some gene sets overlapped, particularly for 4x6T cohorts, and only seven gene sets passed FDR < 0.05 for intracortical 4x6T. In cases where the FDR was 0, scores were reassigned as 0.0001 to visualize the relative -logFDR. g Numbers of genes potentially regulated by miRNAs that comprise the 4x6T cassette (5409 total) that show evidence of 4x6T-specific regulation in IP samples (FDR < 0.05 in either 4x6T cohort vs Aldh1l1-CreERT2 cohort; not differentially regulated in AAV2/5 cohort vs Aldh1l1-CreERT2 cohort). Note: none of the 5409 genes show evidence of 4x6T-specific regulation in input samples. n = 4 mice per cohort; 2–4 months old, euthanized 2 weeks after final tamoxifen administration and 18 days postvirus injection. Titer: retroorbital PHP.eB::GfaABC1D-Cre-4x6T, 1 × 10¹² vg/mouse; intracortical, PHP.eB::GfaABC1D-Cre-4x6T or AAV2/5::GfaABC1D-Cre: 500 nl of 1 × 10¹² vg/ml in each of three sites.

