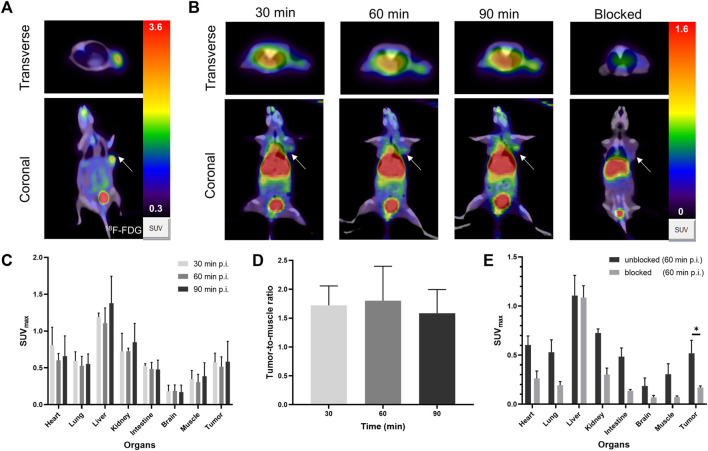
FIGURE 4.
(A) The PET/CT of [18F]F-FDG in U87MG tumor-bearing mice at 60 min post-injection. (B) Representative PET/CT imaging of [68Ga]Ga-FAP-2286-ICG at 30, 60, 90 min post injection and block with excess unlabeled FAP-2286-ICG at 60 min in U87MG tumor-bearing mice; the white arrow indicates the location of the tumor; (C) The SUVmax of major organs in U87MG tumor-bearing mice at three time-points (30, 60, and 90 min); (D) The dynamic changes of SUVmax ratio of tumor-to-background at three time-points (30, 60, and 90 min); (E) [68Ga]Ga-FAP-2286-ICG uptake in U87MG xenograft mice with unblocking or blocking of FAP by excess non-radiolabeled tracer precursor. Data were expressed as mean ± SD (n = 3). *p < 0.05.

