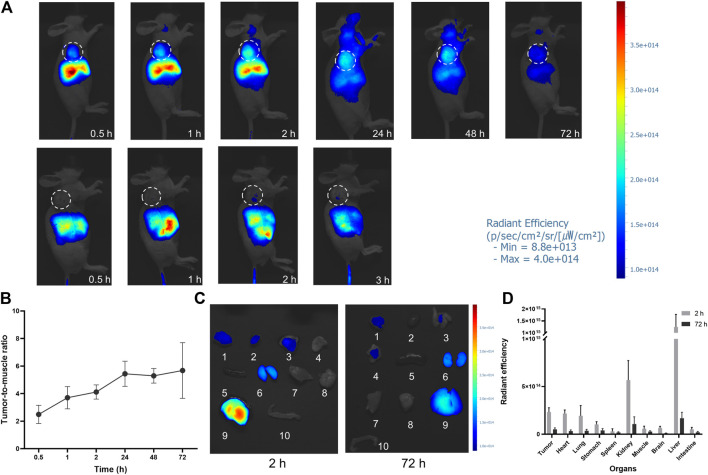
FIGURE 5.
In vivo NIR imaging of FAP-2286-ICG. (A) NIR images of U87MG tumor-bearing mice at different time points after injection of FAP-2286-ICG (upper) or ICG (bottom) (n = 3). The dotted circle indicates the location of the tumor; (B) Tumor-to-muscle ratios of FAP-2286-ICG in U87MG tumor-bearing mice at different time points post-injection; (C) Biodistribution of FAP-2286-ICG in U87MG tumors and main organs at 2 and 72 h post-injection. 1: tumor, 2: heart, 3: lung, 4: stomach, 5: spleen, 6: kidney, 7: muscle, 8: brain, 9: liver, 10: intestine. (D) Quantification of optical signal in main organs at 2 and 72 h post-injection.

